| Preliminary Proxy Statement | |||||||
| o | Confidential, | ||||||
| x | Definitive Proxy Statement | ||||||
| o | Definitive Additional Materials | ||||||
| o | Soliciting Material Pursuant to | ||||||
| x | No fee required. | ||||
| o | Fee computed on table | ||||


| YOUR VOTE IS IMPORTANT. WHETHER OR NOT YOU PLAN TO ATTEND THE MEETING, WE ENCOURAGE YOU TO READ THIS PROXY STATEMENT AND SUBMIT YOUR PROXY OR VOTING INSTRUCTIONS AS SOON AS POSSIBLE. | ||||||||
| PLEASE REFER TO (I) THE INSTRUCTIONS OF THE NOTICE OF INTERNET AVAILABILITY OF PROXY MATERIALS YOU RECEIVED IN THE MAIL, (II) THE SECTION ENTITLED GENERAL INFORMATION ABOUT THE ANNUAL MEETING BEGINNING ON PAGE PROXY STATEMENT, OR (III) IF YOU REQUESTED TO RECEIVE PRINTED PROXY MATERIALS, YOUR ENCLOSED PROXY CARD. | ||||||||
IMPORTANT NOTICE REGARDING THE PROXY MATERIALS FOR THE STOCKHOLDER MEETING TO BE HELD ON NOVEMBER www.edocumentview.com/VIAV | ||||||||

| Business and Financial Results | ||
| Response to Investor Feedback | ||
| Environmental, Social, and Governance Matters | ||
| FY23 Virtual Annual Meeting | ||


 | |||||||||||
Board Succession, Refreshment and Diversity | |||||||||||
| Date | Time | Live Webcast | ||||||||
 |  |  | ||||||||
| Wednesday, November | 8, 2023 | Mountain Time | ||||||||
| 9:30 a.m., | ||||||||||
| Notice of 2023 Annual Meeting | ||
| PROPOSAL | BOARD VOTING RECOMMENDATION | PAGE REFERENCE (FOR MORE DETAIL) | |||||||||
| Management Proposals | |||||||||||
Proposal 1. Election of Directors |  | Vote FOR each Director nominee | 28 | ||||||||
| The Board of Directors (the "Board,” and each member a “Director”) believes that each of the Director nominees has the knowledge, experience, skills and background necessary to contribute to an effective and well-functioning Board. | |||||||||||
Proposal 2. Ratification of the Appointment of PricewaterhouseCoopers LLP as VIAVI’s independent registered public accounting firm for fiscal year 2024 | | Vote FOR | 40 | ||||||||
| The Audit Committee and the Board believe that the continued retention of PricewaterhouseCoopers LLP to serve as VIAVI’s independent auditors is in the best interests of VIAVI and its stockholders. | |||||||||||
Proposal 3. Approval, in a Non-Binding Advisory Vote, of the Compensation for Named Executive Officers | | Vote FOR | 45 | ||||||||
| The Board believes that the compensation of our named executive officers (“NEOs”) as disclosed in this Proxy Statement for FY23 is well aligned with VIAVI’s performance and the interests of our stockholders. | |||||||||||
Proposal 4. Approval, in a Non-Binding Advisory Vote, the Frequency of Stockholder Votes on Executive Compensation | | Vote 1 YEAR | 46 | ||||||||
| The Board believes that it is in the best interest of stockholders to conduct future stockholder votes on executive compensation on an annual basis. | |||||||||||
Proposal 5. Amendment and Restatement of 2003 Plan | | Vote FOR | 47 | ||||||||
| The Board believes that it is in the best interest of stockholders to approve the amendment and restatement of the Restated 2003 Plan. | |||||||||||
Proposal 6. Amendment and Restatement of ESPP Plan | | Vote FOR | 62 | ||||||||
| The Board believes that it is in the best interest of stockholders to approve the amendment and restatement of the 1998 ESPP Plan. | |||||||||||
| Record Date | ||
| Proxy Materials | ||
| Technical Issues | ||
| Asking Questions | ||


IMPORTANT NOTICE REGARDING THE PROXY MATERIALS FOR THE STOCKHOLDER MEETING TO BE HELD ON NOVEMBER www.edocumentview.com/VIAV | |||||||
 | |
 | ||||
 | ||||
 | ||||
| Glance | ||||

 |  |  |  |  |  | ||||||||||||
| Exhibit Business Acumen | Manage Complexity & Ambiguity | Take Informed Risks | Cultivate Innovation | Foster a Winning Culture | Drive Vision & Purpose | ||||||||||||
| VIAVI at a Glance | ||
| Net Revenues down 14.4% year-over-year | GAAP Operating Margin down 690 basis points year-over-year to | Total Consolidated GAAP EPS increased 57.1% year-over-year to | ||||||||||||
| $1.1 Billion | 7.4% | $0.11(1)(2) | ||||||||||||
| Capital Returned to Stockholders in FY23 | Non-GAAP Operating Margin down 660 basis points year-over-year to | Total Consolidated non-GAAP EPS down 42.1% year-over-year to | ||||||||||||
| $83.9 Million | 15.6%(1) | $0.55(1) | ||||||||||||
| VIAVI at a Glance | ||
| What We Do | What We Don’t Do | ||||||||||
 | Compensation Committee is comprised 100% of independent Directors. | x | No employment agreements that provide for fixed terms or automatic compensation increases or equity awards. | ||||||||
| Independent compensation consultant retained by the Compensation Committee | x | No repricing or repurchasing of underwater stock options without stockholder approval. | ||||||||
| Balance short- and long-term incentives, cash and equity and fixed and variable pay elements. | x | No dividends or dividend equivalents on unearned awards. | ||||||||
| Performance-based awards comprising approximately 50% of the overall equity allocation to executive officers. | x | No pledging or hedging of VIAVI securities. | ||||||||
| Require one-year minimum vesting for awards granted under the Amended and Restated 2003 Equity Incentive Plan, subject to certain exceptions. | x | No “single trigger” change in control acceleration of vesting for equity awards. | ||||||||
| Maintain a clawback policy that applies to both cash incentives and equity awards. | x | No excessive perquisites. | ||||||||
| Assess and mitigate compensation risk. | x | No excessive cash severance payments or benefits. | ||||||||
| Solicit an annual advisory vote on executive compensation. | x | No executive pension plans. | ||||||||
| Maintain stock ownership guidelines. | x | No supplemental executive retirement plans. | ||||||||
| x | No "golden parachute" tax gross-ups. | ||||||||||
| VIAVI at a Glance | ||
| FY23 VPP Payout | MSUs Earned in FY23 | FY23 Performance | ||||||
$0 for H1 of FY23 | FY2020 MSUs: 108.25% of 3rd tranche earned | 58.3 percentile TSR ranking | ||||||
FY2021 MSUs: 145.00% of 2nd tranche earned | 73.0 percentile TSR ranking | |||||||
$0 for H2 of FY23 | FY2022 MSUs: 146.00% of 1st tranche earned | 73.4 percentile TSR ranking | ||||||
| VIAVI at a Glance | ||
| Corporate Governance | ||
| Corporate Governance | ||
| Chair of the Board | Chief Executive Officer | ||||
▪Sets the agenda of Board meetings ▪Presides over meetings of the full Board ▪Contributes to Board governance and Board processes ▪Communicates with all Directors on key issues and concerns outside of Board meetings ▪Presides over meetings of stockholders | ▪Sets strategic direction for the Company ▪Creates and implements the Company’s vision and mission ▪Leads the affairs of the Company, subject to the overall direction and supervision of the Board and its committees and subject to such powers as reserved by the Board and its committees | ||||

| Audit Committee Chair | Independent |  | ||||||
| Compensation Committee Chair | Independent |  | ||||||
| Corporate Development Committee Chair | Independent | | ||||||
| Governance Committee Chair | Independent | | ||||||
| Corporate Governance | ||
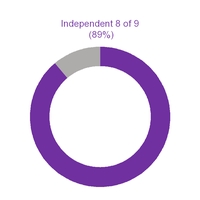
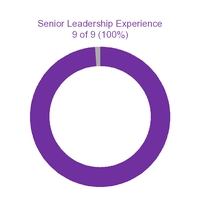
 | 8 out of 9 of our directors are independent (89%). | |||||||||||||||||||
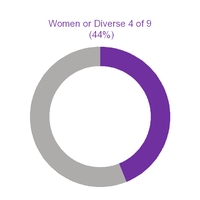
 | Demonstrated commitment to diversity: 3 of our 9 directors (33%) are diverse individuals or women. | |||||||||||||||||||
 | VIAVI regularly reviews board committee leadership, succession, and diversity. |  | Ongoing board refreshment: 3 members of our current board were appointed in the past 6 years. | |||||||||||||||||
| 33% | 34% | 33% | |||||||||||||||
| 0 – 5 YEARS | 6 – 10 YEARS | 10+ YEARS | |||||||||||||||
| Board Size: | ||||||||
| Total Number of Directors | 9 | |||||||
| Gender: | Male | Female | ||||||
| Number of Directors based on gender identity | 7 | 2 | ||||||
| Number of Directors who identify in any of the categories below: | ||||||||
| Asian | 1 | |||||||
| White | 6 | 2 | ||||||
| Corporate Governance | ||
| Corporate Governance | ||
| THE BOARD | ||
| Our Board is ultimately responsible for oversight of risks | ||
| AUDIT COMMITTEE | ||
| The Audit Committee coordinates the Board’s oversight of the Company’s internal controls over financial reporting and disclosure controls and procedures as well as the Company’s cybersecurity and information technology risks, controls and procedures. | ||
| COMPENSATION COMMITTEE | GOVERNANCE COMMITTEE | |||||||
| The Compensation Committee assists the Board in fulfilling its oversight responsibilities with respect to the management of risks arising from our compensation policies and programs as well as succession planning for senior executives and human capital management. | The Governance Committee assists the Board in fulfilling its oversight responsibilities with respect to the management of risks associated with board organization, membership and structure, corporate governance and ESG topics. | |||||||
| Corporate Governance | ||
| Corporate Governance | ||
| Information Security Team |  | Cybersecurity Steering Committee | | Audit Committee | | The Board | ||||||||||||||
| Corporate Governance | ||
 | DIRECTORS | Richard E. Belluzzo | Keith Barnes | Laura Black | Tor Braham | Donald Colvin | Doug Gilstrap | Masood A. Jabbar | Oleg Khaykin | Joanne Solomon | ||||||||||||||||||||||
 |  |  | | | ||||||||||||||||||||||||||||
 | AUDIT COMMITTEE |  |  |  | | |||||||||||||||||||||||||||
 | COMPENSATION COMMITTEE | |  | | ||||||||||||||||||||||||||||
 | CORPORATE DEVELOPMENT COMMITTEE | | | | | |||||||||||||||||||||||||||
 | GOVERNANCE COMMITTEE |  | | | ||||||||||||||||||||||||||||
 | Chair of |  | Committee Member |  | Committee Chairperson | | Financial Expert | ||||||||||||||||
| FY23 Average Board Meeting Attendance | ||
| 92% | ||
| Corporate Governance | ||
| Responsibilities | Current Members | |||||||
| The primary responsibility of the Audit Committee is to assist the full Board in fulfilling its oversight responsibilities with respect to: | Donald Colvin (Chair) Keith Barnes Masood A. Jabbar Joanne Solomon Meetings: 9 meetings during FY23. Attendance: The average attendance of the Directors at Audit Committee meetings in FY23 was 97% Independence: The Board has determined that all members of the Audit Committee are “independent” as defined in the applicable rules and regulations of the SEC and Nasdaq. Financial Experts: The Board has determined that Keith Barnes, Donald Colvin, Masood A. Jabbar and Joanne Solomon are “audit committee financial expert(s)” as defined by Item 407(d) of Regulation S-K of the Exchange Act. | |||||||
•The integrity of the Company’s financial statements and other financial information provided by the Company to its stockholders, the public and others; | ||||||||
▪The Company’s systems of disclosure controls and internal controls regarding finance, accounting, legal compliance and ethical behavior; ▪The Company’s auditing, accounting and financial reporting processes generally; ▪The appointment, qualifications and performance of the Company’s internal audit function and independent auditors; ▪Pre-approval of services (both audit and non-audit) to be provided by the independent auditors; and ▪Review related party transactions. ▪Whether the Company’s independent auditors’ provision of non-audit services is compatible with maintaining the independence of the independent auditors. ▪The Company’s cybersecurity and information security risk management. | ||||||||
A copy of the Audit Committee charter can be viewed at the Company’s website at investor.viavisolutions.com. | ||||||||
| Corporate Governance | ||
| Responsibilities | Current Members | |||||||
| The primary responsibility of the Compensation Committee is to assist the full Board in fulfilling its oversight responsibilities with respect to: | Keith Barnes (Chair) Richard E. Belluzzo Douglas Gilstrap Meetings: 4 meetings during FY23. Attendance: The average attendance of the Directors at Compensation Committee meetings in FY23 was 75%. Independence: The Board has determined that all members of the Compensation Committee are “independent” as defined in the applicable rules and regulations of the SEC and Nasdaq. | |||||||
▪The Company’s overall compensation policies, structure and programs (including with respect to wages, salaries, cash incentives, equity plans, employee benefit plans and other benefits) for its employees and officers; | ||||||||
▪The annual review and approval of the compensation policies applicable to the Company’s executive officers (including the Company’s named executive officers), including the relationship of the Company’s achievement of its goals and objectives to executive compensation; ▪The annual review and recommendation to the Board for approval of corporate goals and objectives relevant to the compensation of the CEO, and to at least annually evaluate the performance of the CEO in light of these goals and objectives; ▪Review matters related to succession planning and executive development for executive officers; ▪Oversee the implementation and administration of the Company’s equity incentive, stock option and stock purchase plans; ▪Review the results of the stockholder advisory vote regarding the Company’s executive compensation (the “Say on Pay Vote”) and make appropriate recommendations to the Board; and ▪Oversee the development, implementation and effectiveness of the Company’s practices, policies and strategies relating to human capital management as they relate to the Company’s workforce generally, including but not limited to policies and strategies regarding recruiting, selection, career development and progression, and diversity, equity and inclusion practices. | ||||||||
| Additional information on the Compensation Committee’s processes and procedures for consideration of executive compensation are addressed in the “Compensation Discussion and Analysis” below. | ||||||||
A copy of the Compensation Committee charter can be viewed at the Company’s website at investor.viavisolutions.com. Doug Gilstrap was appointed to the Compensation Committee effective November 23, 2022. Timothy Campos resigned from the Compensation Committee effective January 9, 2023. | ||||||||
| Corporate Governance | ||
| Responsibilities | Current Members | |||||||
The primary responsibility of the Corporate Development Committee is to assist the full Board in fulfilling its oversight responsibilities with respect to: ▪The review of all strategic transactions for which Board or Corporate Development Committee approval is required and to make appropriate recommendations to the Board with respect to any Strategic Transaction for which Board approval is required. | Laura Black (Chair) Masood A. Jabbar Tor Braham Donald Colvin Meetings: 4 meetings during FY23. Attendance: The average attendance of the Directors at Corporate Development Committee meetings in FY23 was 90%. Independence: The Board has determined that all members of the Corporate Development Committee are “independent” as defined in the applicable rules and regulations of the SEC and Nasdaq. | |||||||
The Corporate Development Committee reviews and approves certain strategic transactions for which approval of the full Board is not required and makes recommendations to the Board regarding those transactions for which the consideration of the full Board is appropriate. A copy of the Corporate Development Committee charter can be viewed at the Company’s website at investor.viavisolutions.com. Effective November 20, 2022, Laura Black was appointed Chair of the Corporate Development Committee. Tim Campos resigned from the Corporate Development Committee effective January 9, 2023. | ||||||||
| Corporate Governance | ||
| Responsibilities | Current Members | |||||||
The primary responsibility of the Governance Committee is to assist the full Board in fulfilling its oversight responsibilities with respect to: | Richard E. Belluzzo (Chair) Keith Barnes Laura Black Meetings: 4 meetings during FY23. Attendance: The average attendance of the Directors at Governance Committee meetings in FY23 was 100%. Independence: The Board has determined that all members of the Governance Committee are “independent” as defined in the applicable rules and regulations of the SEC and Nasdaq. | |||||||
▪Developing, and annually updating, a long-term plan for Board composition that takes into consideration the current strengths, weaknesses, skills and experience on the Board, anticipated retirement dates and the strategic direction of the Company; ▪Develop recommendations regarding the essential and desired skills and experience for potential Directors, taking into consideration the Board’s short and long-term needs; ▪Recommend to the Board nominees for election as members of the Board (in performing this function, the Board has authorized and appointed the Governance Committee to serve as the Company’s Nominating Committee); ▪Review, monitor and make recommendations regarding the orientation and ongoing performance and development of Directors, and develop, recommend and oversee continuing education programs for Directors as and when deemed appropriate; ▪Recommend appropriate Board, committee and individual Director evaluation programs to the Board and oversee the implementation and administration of such programs once approved by the Board; ▪Monitor and evaluate professional, employment and other changes affecting Directors to ensure compliance with Board guidelines and the Company’s Code of Business Conduct; ▪Review and evaluate the Company’s programs, policies and practices relating to ESG and related disclosures; and ▪Review and monitor key public policy trends, issues, regulatory matters and other concerns that may affect the Company’s business, strategies, operations, performance or reputation. | ||||||||
The Governance Committee operates under a written charter setting forth the functions and responsibilities of the committee. A copy of the charter can be viewed at the Company’s website at investor.viavisolutions.com. | ||||||||
| Corporate Governance | ||
| Written Questionnaires | Directors responded to a custom questionnaire, meant to gauge understandings of and effectiveness in board and committee composition and conduct, and individual Director performance, and to identify suggested ways to implement best practices in FY24. | ||||

| Individual Interviews | Certain Directors participated in individual Board Chair interviews, which responded to questions for each of their committee assignments and identified Committee strengths and accomplishments in FY23 together with recommended changes in committee practices for FY24. | ||||
| Group Discussions | In addition to written questionnaires and individual Director interviews, the annual Board, committee, and Director evaluation included group discussions among certain Directors regarding the evaluation process. | ||||
| Review & Report of Results | The findings of the annual Board, committee and Director evaluation process were prepared by Corporate Legal Team to protect the anonymity and the integrity of the evaluation process, with the findings presented to the Governance Committee. | ||||
| Discussion of Results | The Chair of the Governance Committee presented the results of the annual Board, committee, and Director assessment to the Board, and the Directors discussed the results and identified any appropriate follow-up actions. | ||||
| Corporate Governance | ||
| The Governance Committee regularly evaluated the needs of the Board in terms of areas relevant to the Company’s long-term business and strategic objectives as well as considerations regarding diversity, individual and director qualifications, attributes, skills and experience. | ||
| Director nominees are identified with input from directors, search firms, stockholders, and/or members of management. | ||
The Governance Committee evaluates Director nominee qualifications, reviews for potential conflicts, instances of over boarding, independence, and interviews candidates and recommend nominees to theBoard. | ||
| The Board evaluates Director nominees, discusses impacts on the Board, and selects Director nominees for considerations at our annual meetings. | ||
| Our stockholders vote on Director nominees at our annual meetings. | ||
| Corporate Governance | ||


| Corporate Governance | ||
| THE BOARD | ||
| Our Board is responsible for oversight of key ESG risks and opportunities as well as alignment of ESG with our business strategy. | ||

| GOVERNANCE COMMITTEE | ||
Review and evaluate the Company’s programs, policies, and practices relating to ESG and related disclosures. Review and monitor key public policy trends, issues, regulatory matters, and other concerns that may affect the Company’s business, strategies, operations, performance, or reputation. Nominate Director candidates with diverse backgrounds and capabilities to reflect the diverse nature of the Company’s stakeholders (security holders, employees, customers, and suppliers), while emphasizing core excellence in areas pertinent to our long-term business and strategic objectives. | ||
| COMPENSATION COMMITTEE | AUDIT COMMITTEE | |||||||
| Oversee the development, implementation, and effectiveness of the Company’s practices, policies, and strategies relating to human capital management as they relate to the Company’s workforce generally, including but not limited to policies and strategies regarding recruiting, selection, career development and progression, and DEI practices. | Review the Company’s cybersecurity and other information technology risks, controls, and procedures, including review of the threat landscape facing our Company and our Company strategy to mitigate cybersecurity risks and potential breaches. | |||||||
| ESG EXECUTIVE STEERING COMMITTEE | ||
| In FY23, we established a senior executive level ESG Executive Steering Committee, which is responsible for senior management-level oversight of our ESG programs, goals, investments and targets, measuring achievement and aligning ESG practices with our overall business strategy and providing guidance to the ESG Program Committee. The members of the ESG Executive Steering Committee represent a variety of teams and functions, including legal, investor relations, human resources, environmental, health and safety, product compliance, supply chain, finance and marketing. | ||
| Corporate Governance | ||

| Proposal 1 | |||||||||
 |  | ||||||||
 |  | ||||||||
| | ||||||||
| | ||||||||
| | ||||||||
| | ||||||||
| | ||||||||
| |||||||||
| |||||||||
| Directors | |||||||||
 | |
| |
| |


| Nominee | Age at Proxy Date | Primary Occupation | Director Since | ||||||||
| Richard E. Belluzzo (Board Chair) | 69 | US Venture Partner of Innogest SGR SpA | February 2005 | ||||||||
| Keith Barnes | 72 | Former Chief Executive Officer and Chair of the Board of Verigy Ltd. | October 2011 | ||||||||
| Laura Black | 62 | Managing Director of Needham & Company, LLC | February 2018 | ||||||||
| Tor Braham | 66 | Former Managing Director and Global Head, Technology, M&A for Deutsche Bank Securities | October 2015 | ||||||||
| Donald Colvin | 70 | Former Interim Chief Financial Officer of Isola Group Ltd. | October 2015 | ||||||||
| Douglas Gilstrap | 59 | Senior Industrial Advisor and Venture Partner at EQT and TCV | November 2022 | ||||||||
| Masood A. Jabbar | 73 | Former Chief Executive Officer of XDS Inc. | March 2006 | ||||||||
| Oleg Khaykin | 58 | Chief Executive Officer of Viavi Solutions Inc. | February 2016 | ||||||||
| Joanne Solomon | 57 | Former Chief Financial Officer of Maxeon Solar Technologies | February 2022 | ||||||||
| Proposal 1 | ||
| Corporate Governance | ||
| Responsibilities | Current Members | |||||||
The primary responsibility of the Governance Committee is with respect to: | Richard E. Belluzzo (Chair) Keith Barnes Laura Black Meetings: 4 meetings during FY23. Attendance: The average attendance of the Directors at Governance Committee meetings in FY23 was 100%. Independence: The Board has determined that all members of the Governance Committee are “independent” as defined in the applicable rules and regulations of the SEC and Nasdaq. | |||||||
▪Developing, and annually updating, a long-term plan for ▪Develop recommendations regarding the essential and desired skills and experience for potential Directors, taking into consideration the Board’s short and long-term needs; ▪Recommend to the Board nominees for election as members of the Board (in performing this function, the Board has authorized and appointed the Governance Committee to serve as the Company’s Nominating Committee); ▪Review, monitor and make recommendations regarding the orientation and ongoing performance and development of Directors, and develop, recommend and oversee continuing education programs for Directors as and when deemed appropriate; ▪Recommend appropriate Board, committee and individual Director evaluation programs to the Board and oversee the implementation and administration of such programs once approved by the Board; ▪Monitor and evaluate professional, employment and other changes affecting Directors to ensure compliance with Board guidelines and the Company’s ▪Review and evaluate the Company’s programs, policies and practices relating to ESG and related disclosures; and ▪Review and monitor key public policy trends, issues, regulatory matters and other concerns that may affect the Company’s business, strategies, operations, performance or reputation. | ||||||||
The Governance Committee | ||||||||
| Corporate Governance | ||
| Written Questionnaires | Directors responded to a custom questionnaire, meant to gauge understandings of and effectiveness in board and committee composition and conduct, and individual Director performance, and to identify suggested ways to implement best practices in FY24. | ||||
| Individual Interviews | Certain Directors participated in individual Board Chair interviews, which responded to questions for each of their committee assignments and identified Committee strengths and accomplishments in FY23 together with recommended changes in committee practices for FY24. | ||||
| Group Discussions | In addition to written questionnaires and individual Director interviews, the annual Board, committee, and Director evaluation included group discussions among certain Directors regarding the evaluation process. | ||||
| Review & Report of Results | The findings of the annual Board, committee and Director evaluation process were prepared by Corporate Legal Team to protect the anonymity and the integrity of the evaluation process, with the findings presented to the Governance | ||||
| Discussion of Results | The Chair of the Governance Committee presented the results of the annual Board, committee, and Director assessment to | ||||
| Corporate Governance | ||
| The Governance Committee regularly evaluated the needs of the Board in terms of areas relevant to the Company’s long-term business and strategic objectives as well as considerations regarding diversity, individual and director qualifications, attributes, skills and experience. | ||
| Director nominees are identified with input from directors, search firms, stockholders, and/or members of management. | ||
The Governance Committee evaluates Director nominee qualifications, reviews for potential conflicts, instances of over boarding, independence, and interviews candidates and recommend nominees to theBoard. | ||
| The Board evaluates Director nominees, discusses impacts on the Board, and selects Director nominees for considerations at our annual meetings. | ||
| Our stockholders vote on Director nominees at our annual meetings. | ||
| Corporate Governance | ||
| Corporate Governance | ||
| Corporate Governance | ||
| Corporate Governance | ||
| THE BOARD | ||
| Our Board is responsible for oversight of key ESG risks and opportunities as well as alignment of ESG with our business strategy. | ||
| GOVERNANCE COMMITTEE | ||
Review and evaluate the Company’s programs, policies, and practices relating to ESG and related disclosures. Review and monitor key public policy trends, issues, regulatory matters, and other concerns that may affect the Company’s business, strategies, operations, performance, or reputation. Nominate Director candidates with diverse backgrounds and capabilities to reflect the diverse nature of the Company’s stakeholders (security holders, employees, customers, and suppliers), while emphasizing core excellence in areas | ||
| COMPENSATION COMMITTEE | AUDIT COMMITTEE | |||||||
| Oversee the development, implementation, and effectiveness of the Company’s | Review the | |||||||
| ESG EXECUTIVE STEERING COMMITTEE | ||
| In FY23, we established a senior executive level ESG Executive Steering Committee, which is responsible for senior management-level oversight of our ESG programs, goals, investments and targets, measuring achievement and aligning ESG practices with our overall business | ||
| Corporate Governance | ||
| Proposal 1 | Election of | ||||
| Nominee | Age at Proxy Date | Primary Occupation | Director Since | ||||||||
| Richard E. Belluzzo | 69 | US Venture Partner of Innogest SGR SpA | February | ||||||||
| Keith Barnes | 72 | Former Chief Executive Officer Ltd. | October 2011 | ||||||||
| Laura Black | 62 | Managing Director of Needham & Company, LLC | February 2018 | ||||||||
| Tor Braham | 66 | Former Managing Director and Global Head, Technology, | October 2015 | ||||||||
| Donald Colvin | 70 | Former Interim Chief Financial Officer of Isola Group Ltd. | October 2015 | ||||||||
| Douglas Gilstrap | 59 | Senior Industrial Advisor and | November 2022 | ||||||||
| Masood A. Jabbar | 73 | Former Chief Executive Officer of | March 2006 | ||||||||
| Oleg Khaykin | 58 | Chief | February 2016 | ||||||||
| Joanne Solomon | 57 | Former Chief Financial Officer of | February 2022 | ||||||||
| Proposal 1 | ||

| Corporate Governance | ||
| Corporate Governance | ||
| Written Questionnaires | Directors responded to a custom questionnaire, meant to gauge understandings of and effectiveness in board and committee composition and conduct, and individual Director performance, and to identify suggested ways to implement best practices in FY24. | ||||
| Individual Interviews | Certain Directors participated in individual Board Chair interviews, which responded to questions for each of their committee assignments and identified Committee strengths and accomplishments in FY23 together with recommended changes in committee practices for FY24. | ||||
| Group Discussions | In addition to written questionnaires and individual Director interviews, the | ||||
| Review & Report of Results | The findings of the | ||||||||
| Discussion of Results | The Chair of the | ||||
| Corporate Governance | ||
| The Governance Committee regularly evaluated the needs of the Board in terms of areas relevant to the Company’s long-term business and strategic objectives as well as considerations regarding diversity, individual and director qualifications, attributes, skills and experience. | ||
| Director nominees are identified with input from directors, search firms, stockholders, and/or | ||
The Governance Committee evaluates Director nominee qualifications, reviews for potential conflicts, instances of over boarding, independence, and interviews candidates and recommend nominees to the | ||
| The Board evaluates Director nominees, discusses impacts on the | ||
| Our stockholders vote on Director nominees at our | ||
| Corporate Governance | ||
| Corporate Governance | ||
| Corporate Governance | ||
| THE BOARD | ||
| Our Board is responsible for oversight of key ESG risks and opportunities as well as alignment of ESG with our business strategy. | ||
| GOVERNANCE COMMITTEE | ||
Review and evaluate the Company’s programs, policies, and practices relating to ESG and related disclosures. Review and monitor key public policy trends, issues, regulatory matters, and other concerns that may affect the Company’s business, strategies, operations, performance, or reputation. Nominate Director candidates with diverse backgrounds and capabilities to reflect the diverse nature of the Company’s stakeholders (security holders, employees, customers, and suppliers), while emphasizing core excellence in areas pertinent to our long-term business and strategic objectives. | ||
| COMPENSATION COMMITTEE | AUDIT COMMITTEE | |||||||
| Oversee the development, implementation, and effectiveness of the Company’s practices, policies, and strategies relating to human capital management as they relate to the Company’s workforce generally, including but not limited to policies and strategies regarding recruiting, selection, career development and progression, and DEI practices. | Review the Company’s cybersecurity and other information technology risks, controls, and procedures, including review of the threat landscape facing our Company and our Company strategy to mitigate cybersecurity risks and potential breaches. | |||||||
| ESG EXECUTIVE STEERING COMMITTEE | ||
| In FY23, we established a senior executive level ESG Executive Steering Committee, which is responsible for senior management-level oversight of our ESG programs, goals, investments and targets, measuring achievement and aligning ESG practices with our overall business strategy and providing guidance to the ESG Program Committee. The members of the ESG Executive Steering Committee represent a variety of teams and functions, including legal, investor relations, human resources, environmental, health and safety, product compliance, supply chain, finance and marketing. | ||
| Corporate Governance | ||
| Proposal 1 | Election of Directors | ||||
| Nominee | Age at Proxy Date | Primary Occupation | Director Since | ||||||||
| Richard E. Belluzzo (Board Chair) | 69 | US Venture Partner of Innogest SGR SpA | February 2005 | ||||||||
| Keith Barnes | 72 | Former Chief Executive Officer and Chair of the Board | October 2011 | ||||||||
| Laura Black | 62 | Managing Director of Needham & Company, | February 2018 | ||||||||
| Tor Braham | 66 | Former Managing Director and Global Head, Technology, M&A for Deutsche Bank Securities | October 2015 | ||||||||
| Donald Colvin | 70 | Former Interim Chief Financial Officer of Isola Group Ltd. | October 2015 | ||||||||
| Douglas Gilstrap | 59 | Senior Industrial Advisor and Venture Partner at EQT and TCV | November 2022 | ||||||||
| Masood A. Jabbar | 73 | Former Chief Executive Officer of XDS Inc. | March 2006 | ||||||||
| Oleg Khaykin | 58 | Chief Executive Officer of Viavi Solutions Inc. | February 2016 | ||||||||
| Joanne Solomon | 57 | Former Chief Financial Officer of Maxeon Solar Technologies | February 2022 | ||||||||
| Proposal 1 | ||
| Proposal 1 | ||
| Qualifications, Expertise and | Richard E. Belluzzo | Keith Barnes | Laura Black | Tor Braham | Donald Colvin | Douglas Gilstrap | Masood A. Jabbar | Oleg Khaykin | Joanne Solomon | |||||||||||||||||||||||
 | LEADERSHIP AND EXECUTIVE EXPERIENCE |  |  | | | | | | ||||||||||||||||||||||||
 | GLOBAL BUSINESS PERSPECTIVE | | | | | | | | | |||||||||||||||||||||||
 | INDUSTRY KNOWLEDGE | | | | | | | | ||||||||||||||||||||||||
 | INSTITUTIONAL KNOWLEDGE | | | | | | ||||||||||||||||||||||||||
 | HUMAN CAPITAL MANAGEMENT | | | | | | | |||||||||||||||||||||||||
 | FINANCIAL/ AUDIT | | | | | | | | | | ||||||||||||||||||||||
 | CYBERSECURITY/ PRIVACY/RISK | | | | | | ||||||||||||||||||||||||||
 | STRATEGIC TRANSACTIONS/M&A | | | | | | | | | | ||||||||||||||||||||||
 | SALES AND MARKETING | | | | | | ||||||||||||||||||||||||||
 | TECHNOLOGY | | | | | | ||||||||||||||||||||||||||
| Proposal 1 | ||
| Director Nominee Skills | ||
DIRECTOR NOMINEE SKILLS The | |||||||||||
| LEADERSHIP AND EXECUTIVE EXPERIENCE | Oversaw the execution of important strategic, operational and policy issues while serving in an executive or senior leadership role at | |||||||||
| GLOBAL BUSINESS PERSPECTIVE | Experience cultivating and sustaining business relationships internationally and overseeing multinational operations. Breadth of experience, including geographic/regional experience (e.g., head of company in | |||||||||
| INDUSTRY KNOWLEDGE | Significant knowledge of our | |||||||||
| INSTITUTIONAL KNOWLEDGE | Significant knowledge of our business strategy, operations, key performance indicators and competitive environment. | |||||||||
| HUMAN CAPITAL MANAGEMENT | Experience recruiting, managing, developing and optimizing a | |||||||||
| FINANCIAL/ AUDIT | Knowledge of financial markets, financing operations, complex financial management and | |||||||||
| CYBERSECURITY/ PRIVACY/RISK | Experience managing cybersecurity and information | |||||||||
| STRATEGIC TRANSACTIONS/M&A | A history of leading growth through acquisitions, other business combinations and | |||||||||
| SALES AND MARKETING | Experience in sales management, marketing campaign management, advertising or public relations. | |||||||||
| TECHNOLOGY | A significant background working in technology, resulting in knowledge of how to anticipate technological trends, generate disruptive innovation and | |||||||||
| Proposal 1 | ||
| Proposal 1 | ||
| Proposal 1 | ||
| Proposal 1 | ||
| Proposal 1 | ||
| Proposal 1 | ||
| Compensation Element for Role | Board Compensation | ||||
| General Board Service – Cash | |||||
| Annual Retainer | $ | ||||
| General Board Service – Equity | |||||
| Annual RSU Grant | Grant Value of | ||||
| Vesting Schedule | Vest on the first anniversary of the grant date | ||||
| Number of shares determined using 30 calendar day average stock price prior to date of grant | |||||
| Chair | Member | |||||||||||||
| Committee Service Annual Retainer | Audit | $ | 32,000 | $ | 15,000 | |||||||||
| Compensation | $ | 24,000 | $ | 10,000 | ||||||||||
| Governance/Corporate Development/ Cyber Risk | $ | 15,000 | $ | 7,500 | ||||||||||
| Non-Employee Board Chair | ||||||||||||||
| Additional Board Retainer | $75,000 | |||||||||||||
| Chair | Member | ||||||||
| Committee Service | Audit | $ | 30,000 | $ | 15,000 | ||||
| (No meeting fees) | Compensation | $ | 20,000 | $ | 10,000 | ||||
| Governance/Corporate Development | $ | 15,000 | $ | 7,500 | |||||
| Non-Employee Board Chair | |||||||||
| Additional Board Retainer | $ | 75,000 | |||||||
| Additional Equity | NA | ||||||||
| DIRECTOR COMPENSATION | |||||||
Name (1) | Fees Earned or Paid in Cash ($) | Stock Awards ($) (2) | Total ($) | ||||
| Keith Barnes | 102,500 | 203,574 | 306,074 | ||||
| Richard E. Belluzzo | 160,000 | 203,574 | 363,574 | ||||
| Laura Black | 70,541 | (3) | 203,574 | 274,115 | |||
| Tor Braham | 67,500 | 203,574 | 271,074 | ||||
| Timothy Campos | 77,500 | 203,574 | 281,074 | ||||
| Donald Colvin | 97,500 | 203,574 | 301,074 | ||||
| Glenda Dorchak | 54,101 | (4) | 202,007 | 256,108 | |||
| Masood A. Jabbar | 90,000 | 203,574 | 293,574 | ||||
| Proposal 1 | ||
| DIRECTOR COMPENSATION | ||
Name (1) | Fees Earned or Paid in Cash ($) | Stock Awards ($) (2) | Total ($) | ||||||||
| Keith Barnes | 116,500 | 170,986 | 287,486 | ||||||||
| Richard E. Belluzzo | 170,000 | 170,986 | 340,986 | ||||||||
| Laura Black | 106,247 | 170,986 | 277,233 | ||||||||
| Tor Braham | 77,500 | 170,986 | 248,486 | ||||||||
Timothy Campos(3) | 67,500 | 170,986 | 238,486 | ||||||||
| Donald Colvin | 109,500 | 170,986 | 280,486 | ||||||||
| Douglas Gilstrap | 70,720 | 169,752 | 240,472 | ||||||||
| Masood A. Jabbar | 92,500 | 170,986 | 263,486 | ||||||||
| Joanne Solomon | 90,247 | 170,986 | 261,233 | ||||||||
| Non-Employee Director | Unvested Restricted Stock Units Outstanding At Fiscal Year End | |||||
| Mr. Barnes | 15,418 | |||||
| Mr. Belluzzo | 15,418 | |||||
| Ms. Black | 15,418 | |||||
| Mr. Braham | 15,418 | |||||
Mr. Campos(i) | – | |||||
| Mr. Colvin | 15,418 | |||||
15,418 | ||||||
| Mr. Jabbar | ||||||
| Ms. Solomon | 15,418 | |||||
| Proposal 2 | ||
| Proposal 2 | Ratification of Independent Auditors | ||||
| Fiscal 2023 | Fiscal 2022 | |||||||
Audit Fees (1) | $ | 3,109,500 | $ | 3,576,176 | ||||
Audit-Related Fees (2) | — | — | ||||||
Tax Fees (3) | 233,300 | 228,934 | ||||||
All Other Fees (4) | 4,500 | 4,500 | ||||||
| Total | $ | 3,347,300 | $ | 3,809,610 | ||||
| Proposal 2 | ||
| Executive Officer | Age | Position | ||||||
| Oleg Khaykin | President and Chief Executive Officer (“CEO”) | |||||||
| Executive Vice President and Chief Financial Officer (“CFO”) | ||||||||
| Pam Avent | 60 | Interim Chief Financial Officer ("Interim CFO”) | ||||||
| Paul McNab | Executive Vice President and Chief Marketing and Strategy Officer | |||||||
| Ralph Rondinone | Senior Vice President, Global Operations and Services, Network and Service Enablement | |||||||
| Luke Scrivanich | Senior Vice President and General Manager, Optical Security & Performance Products (OSP) | |||||||
| Kevin Siebert | Senior Vice President, General Counsel and Secretary | |||||||
| Gary Staley | Senior Vice President, Global Sales, Network and Service Enablement | |||||||
| Fiscal 2020 | Fiscal 2019 | |||||
Audit Fees (1) | $ | 3,646,606 | $ | 3,631,575 | ||
Audit-Related Fees(2) | — | — | ||||
Tax Fees (3) | 139,180 | 169,776 | ||||
All Other Fees (4) | 4,500 | 4,500 | ||||
| Total | $ | 3,790,286 | $ | 3,805,851 | ||
| Proposal 4 | Advisory Vote on the Frequency of Future Advisory Votes on Executive Compensation | ||||
| Proposal 5 | Amendment and Restatement of 2003 Equity Incentive Plan | ||||
| Proposal 5 | ||
| Proposal 5 | ||
| Proposal 5 | ||
| Equity Plan | Stock Options (# of shares) | Weighted-Average Exercise Price Per Share ($) | Weighted-Average Remaining Contractual Term (In Years) | Full Value Awards (# of shares)(1) | Shares Available for Future Grant (# of shares) | ||||||||||||
| 2003 Plan | - | - | - | 9,155,667 | 3,829,361 | ||||||||||||
CEO Inducement Option(2) | 1,180,257 | $ | 5.95 | 0.42 | - | - | |||||||||||
| Total | 1,180,257 | $ | 5.95 | 0.42 | 9,155,667 | 3,829,361 | |||||||||||
| Proposal 5 | ||
| Fiscal 2023 | Fiscal 2022 | Fiscal 2021 | |||||||||
| Gross Burn Rate(1) | 1.6 | % | 1.2 | % | 1.7 | % | |||||
| Net Burn Rate(2) | 1.5 | % | 1.1 | % | 1.5 | % | |||||
| Equity Overhang(3) | 6.7 | % | 7.5 | % | 8.5 | % | |||||
| Fiscal Year | Option Awards Granted | Total Full-Value Awards Granted | Time Based Full-Value Awards Granted | Performance Based Full-Value Awards Granted(1) | Performance Based Full-Value Awards Earned(2) | ||||||||||||
| 2023 | 0 | 3,769,347 | 3,083,165 | 686,182 | 594,667 | ||||||||||||
| 2022 | 0 | 2,819,635 | 2,419,284 | 400,351 | 381,659 | ||||||||||||
| 2021 | 0 | 4,535,449 | 3,359,647 | 1,175,802 | 573,972 | ||||||||||||
| Proposal 5 | ||
| Proposal 5 | ||
| Proposal 5 | ||
| Proposal 5 | ||
| Proposal 5 | ||
| Proposal 5 | ||
| Proposal 5 | ||
| Proposal 5 | ||
| Name and Position | Dollar Value ($) | Number of Shares Underlying Stock Awards | ||||||
Oleg Khaykin President, Chief Executive Officer and Director | $ | — | — | |||||
Henk Derksen Former Executive Vice President and Chief Financial Officer(1) | $ | — | — | |||||
Paul McNab Executive Vice President and Chief Marketing & Strategy Officer | $ | — | — | |||||
Luke Scrivanich Senior Vice President and General Manager, Optical Security & Performance Products | $ | — | — | |||||
Gary Staley Senior Vice President, Global Sales, Network Enablement and Service Enablement | $ | — | — | |||||
Executive officer group (7 persons)(2) | $ | — | — | |||||
Non-Employee Director Group (8 persons)(3) | $ | 1,680,000 | — | |||||
| Non-Executive Officer Employee Group | $ | — | — | |||||
| Proposal 5 | ||
Name of Individual or Group(1) | Number of Shares | ||||
Oleg Khaykin(2) President and Chief Executive Officer | 3,249,136 | ||||
Henk Derksen Former Executive Vice President and Chief Financial Officer(3) | 382,432 | ||||
Paul McNab Executive Vice President and Chief Marketing & Strategy Officer | 922,134 | ||||
Luke Scrivanich Senior Vice President & General Manager, Optical Security and Performance Products | 1,389,986 | ||||
Gary Staley Senior Vice President, Global Sales, Network Enablement and Service Enablement | 546,434 | ||||
All current executive officers as a group(3)(4) | 7,970,129 | ||||
All current directors who are not executive officers as a group(5) | 1,501,267 | ||||
| Each nominee for election as a director | |||||
| Keith Barnes | 277,477 | ||||
| Richard E. Belluzzo | 419,385 | ||||
| Laura Black | 92,149 | ||||
| Tor Braham | 161,705 | ||||
| Donald Colvin | 161,705 | ||||
| Douglas Gilstrap | 15,418 | ||||
| Masood A. Jabbar | 347,852 | ||||
| Oleg Khaykin | 3,249,136 | ||||
| Joanne Solomon | 25,576 | ||||
All employees, including all current officers who are not executive officers, as a group(6) | 154,975,996 | ||||
| Proposal 5 | ||
| Proposal 6 | Amendment and Restatement of 1998 Employee Stock Purchase Plan | ||||
| Proposal 6 | ||
| Proposal 6 | ||
| Proposal 6 | ||
| Proposal 6 | ||
| Proposal 6 | ||
| Proposal 6 | ||
Number of Shares Beneficially Owned | ||||
| Name | Number | Percentage | ||
5% or more Stockholders (1) | ||||
BlackRock, Inc. 55 East 52nd Street New York, NY 10055 (2) | 43,632,626 | 19.1 | % | |
The Vanguard Group 100 Vanguard Blvd. Malvern, PA 19355 (3) | 24,678,871 | 10.8 | % | |
| Directors and Executive Officers | ||||
Oleg Khaykin (4) | 941,212 | * | ||
Amar Maletira (5) | 314,031 | * | ||
Paul McNab (6) | 82,765 | * | ||
Luke Scrivanich (7) | 85,356 | * | ||
Gary Staley(8) | 97,386 | * | ||
| Richard E. Belluzzo | 208,397 | * | ||
| Keith Barnes | 116,214 | * | ||
| Laura Black | 34,354 | * | ||
| Tor Braham | 103,910 | * | ||
| Timothy Campos | 107,365 | * | ||
| Donald Colvin | 103,910 | * | ||
| Glenda Dorchak | — | * | ||
| Masood A. Jabbar | 215,719 | * | ||
All directors and executive officers as a group (15 persons) (9) | 2,542,638 | 1.1 | % | |
Name of Individual or Group(1) | Shares | ||||
Oleg Khaykin(2) President and Chief Executive Officer | 14,051 | ||||
Henk Derksen Former Executive Vice President and Chief Financial Officer(3) | 4,685 | ||||
Paul McNab Executive Vice President and Chief Marketing & Strategy Officer | 0 | ||||
Luke Scrivanich Senior Vice President & General Manager, Optical Security and Performance Products | 19,694 | ||||
Gary Staley Senior Vice President, Global Sales, Network Enablement and Service Enablement | 12,171 | ||||
All current executive officers as | 62,178 | ||||
All current directors who are not executive officers as | — | ||||
| Each nominee for election as a director | |||||
| Keith Barnes | — | ||||
| Richard E. Belluzzo | — | ||||
| Laura Black | — | ||||
| Tor Braham | — | ||||
| Donald Colvin | — | ||||
| Douglas Gilstrap | — | ||||
| Masood A. Jabbar | — | ||||
| Oleg Khaykin | 14,051 | ||||
| Joanne Solomon | — | ||||
All employees, including all current officers who are not executive officers, as a group (6) | 27,547,102 | ||||
| Oleg Khaykin | President and Chief Executive Officer (our “CEO”) | ||||
| Henk Derksen | Former Executive Vice President and Chief Financial Officer (our “CFO”) (1) | ||||
| Paul McNab | Executive Vice President and Chief Marketing & Strategy Officer | ||||
| Luke Scrivanich | Senior Vice President Optical Security & Performance Products | ||||
| Gary Staley | Senior Vice President, Global Sales, Network and Service Enablement | ||||
| |||
| | ||
| | ||
| Business Results | |||
| Named Executive Officer | Fiscal Year 2020 VPP H1 Payout | Fiscal Year 2020 VPP H2 Payout |
| Oleg Khaykin | $513,600 | $0 |
| Amar Maletira | $267,500 | $0 |
| Paul McNab | $236,640 | $0 |
| Luke Scrivanich | $135,966 | $0 |
| Gary Staley | $189,656 | $0 |
| Net Revenues down 14.4% year-over-year | GAAP Operating Margin down 690 basis points year-over-year to | Total Consolidated GAAP EPS increased 57.1% year-over-year to | |||||||||||||
| $1.1 Billion | 7.4% | $0.11(1)(2) | |||||||||||||
 |  | ||||||||||||||
| | ||||||||||||||
| | ||||||||||||||
| | ||||||||||||||
| | ||||||||||||||
| | ||||||||||||||
| | ||||||||||||||
| |||||||||||||||
| |||||||||||||||
| Non-GAAP Operating Margin down 660 basis points year-over-year to | Total Consolidated non-GAAP EPS down 42.1% year-over-year to | |||||||||||||
| $83.9 Million | 15.6%(1) | $0.55(1) |
| Compensation Discussion and Analysis | ||
| Incentive Awards | Performance Highlights | Commentary | ||||||
| FY23 Target Annual Cash Incentive Award Opportunities (as a percentage of base salary) | Zero payouts to executives for both the H1 and H2 bonuses. H1 Aggregate Achievement Against Financial Goals: Corporate: 0%; NSE: 0%; OSP: 11%(1); NSE Sales: 0% H2 Aggregate Achievement Against Financial Goals: Corporate: 0%; NSE: 0%; OSP: 0%; NSE Sales: 28%(2) (1)(2) Mr. Scrivanich and Mr. Staley each declined FY23 cash incentive award payment | Payouts were subject to the achievement of a threshold performance level. Financial goals were weighted at 100% and capped at 150% payout, except in the case of Mr. Staley’s NSE sales booking goal, which is capped at 250% payout with respect to 40% of his target annual cash incentive award opportunity. | ||||||
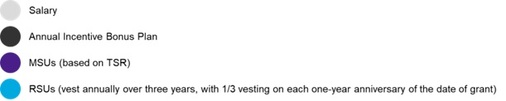
Market-based Stock Units (“MSUs”)(1) | ▪FY20 MSUs: 108.3%of 3rd tranche earned, based on our 58.3 percentile TSR ranking ▪FY21 MSUs: 145% of 2nd tranche earned, based on our 73 percentile TSR ranking ▪FY22 MSUs: 146% of 1st tranche earned, based on our 73.4 percentile TSR ranking ▪FY21 CFO New Hire MSUs: 139.3% of 2nd tranche earned, based on our 70.7 percentile TSR ranking(2) (1)Earned based on total shareholder return through 9/15/22 (2)Mr. Derksen received MSUs with four vesting tranches in connection with his new hire awards, which vest over four years. | Earned based on our total stockholder return (“TSR”) relative to the performance of companies in the Nasdaq Telecommunications Index (the “Nasdaq Telecom Index”) measured over one-year, two-year and three-year performance periods. Above median (55th percentile) performance required for a target payout. | ||||||
| FY21 Retention Awards: Performance-based Stock Units (“PSUs”) | ▪0% of PSUs have vested | There have been no shares awarded to any of our NEOs under the PSUs. The PSUs, which vest based on share price, have not vested as the share price target of $20 has not been achieved. In FY23, our Board determined that our CEO achieved his Executive Leadership Development and Succession Plan goals. However, our CEO’s PSUs, which are associated with such goals remain subject to his continuing to provide services through February 2025 at which time such PSUs will vest in full. | ||||||
| Compensation Discussion and Analysis | ||
| Compensation Discussion and Analysis | ||
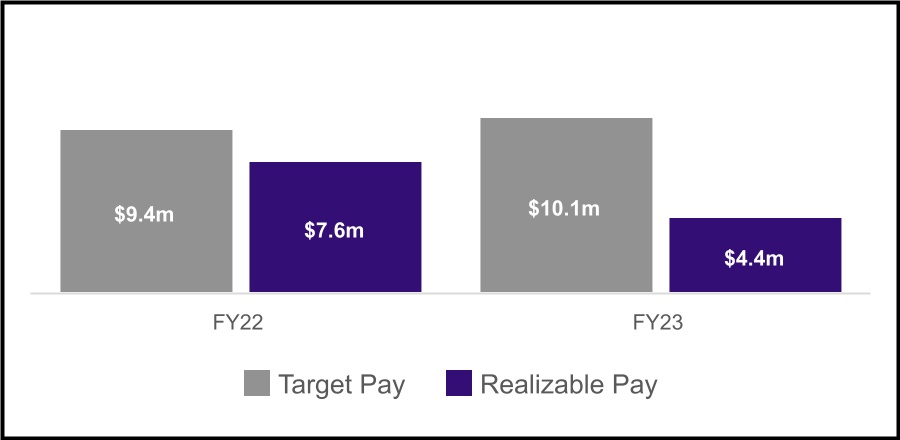
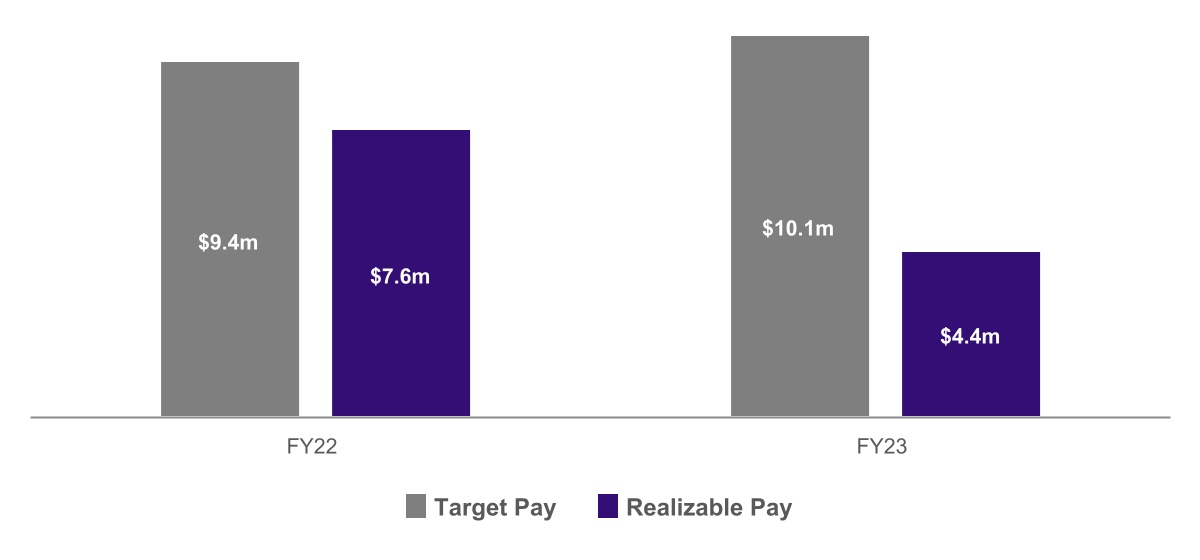
| ($) | FY22 Target | FY22 Realizable | FY23 Target | FY23 Realizable | ||||||||||
| Base Salary | $849,038 | $849,038 | $895,192 | $895,192 | ||||||||||
| Non-Equity Incentive Plan Compensation | $1,018,846 | $938,369 | $1,118,990 | — | ||||||||||
| RSUs | $3,460,542 | $2,574,821 | $3,713,800 | 2,891,915 | ||||||||||
| MSUs | $4,087,467 | $3,204,422 | $4,364,672 | 627,545 | ||||||||||
| Compensation Discussion and Analysis | ||
| No Vesting to Date | ||
CEO Retention Awards(1)(2) | ||

| Compensation Discussion and Analysis | ||
| Pay for Performance | Competitiveness | Outperformance | ||||||||||||
| Align executive compensation to the success of our business objectives and the VIAVI growth strategy | Provide competitive compensation that attracts and retains top-performing executive officers | Motivate executive officers to achieve results that exceed our strategic plan targets | ||||||||||||
| Stockholder Alignment | Balance | Internal Pay Equity | ||||||||||||
| Align the interests of executive officers and stockholders through the managed use of long-term incentives | Set performance goals that reward an appropriate balance of near- and long-term results | Promote collaboration among executive officers by considering internal pay equity in setting compensation levels | ||||||||||||
 |  | |||||||
What We Do •Compensation Committee is comprised 100% of independent Directors. •Independent compensation consultant retained by the Compensation Committee. •Balance short- and long-term incentives, cash and equity and fixed and variable pay elements. •Performance-based equity awards comprising approximately 50% of the overall equity allocation to executive officers. •Require one-year minimum vesting for equity awards, subject to certain limited exceptions. •Maintain a clawback policy that applies to both cash incentives and equity awards. •Assess and mitigate compensation risk. •Solicit an annual advisory vote on named executive officer compensation. •Maintain stock ownership guidelines. | What We Don’t Do •No employment agreements that provide for fixed terms or automatic compensation increases or equity awards. •No repricing or repurchasing of underwater stock options without stockholder approval. •No dividends or dividend equivalents on unearned awards. •No pledging or hedging of VIAVI securities. •No “single trigger” change in control acceleration of vesting for equity awards. •No excessive perquisites. •No excessive cash severance payments or benefits. •No executive pension plans •No supplemental executive retirement plans. •No "golden parachute" tax gross-ups. | |||||||
| Compensation Discussion and Analysis | ||
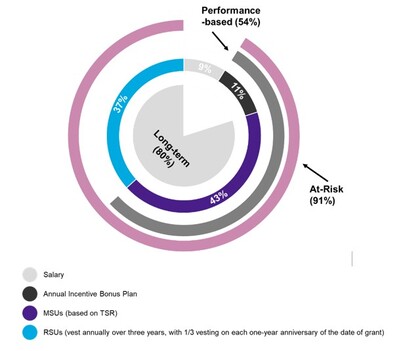
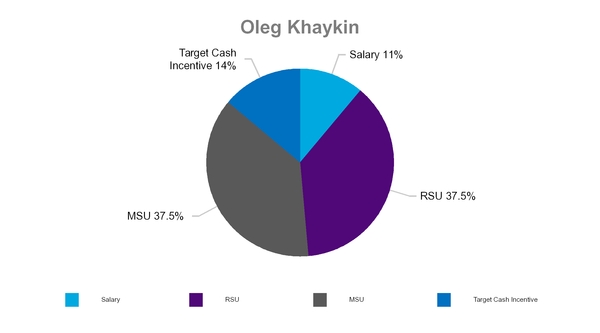
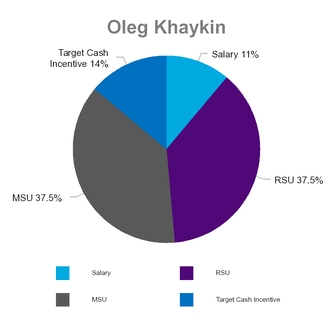
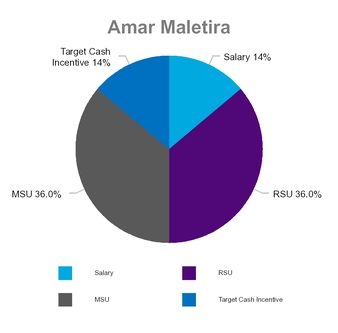
FY23 CEO TARGET COMPENSATION(1) | FY23 OTHER NEO TARGET COMPENSATION(1) | ||||
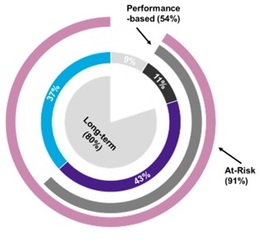 | 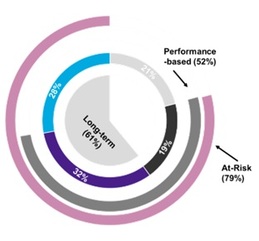 | ||||
| Compensation Discussion and | ||
| Core FY23 Compensation Elements | ||
| Base Salary | |||||
| Purpose: | Base salaries compensate our NEOs for expected levels of day-to-day performance. | ||||
| Characteristics: | Base salaries should be determined by each NEO’s role and | ||||
| Annual Cash Incentive Awards | ||||||||
| Purpose: | Align NEO performance with near-term financial objectives goals. | |||||||
| Characteristics: | Cash incentive payments can be earned by our NEOs only if we achieve a significant level of our financial | |||||||
| Annual MSUs | |||||
| Purpose: | |||||
| Characteristics: | |||||
| Annual RSUs | |||||
| Purpose: | Align interests of NEOs and stockholders through incentivizing long-term stock price growth on an absolute basis and encouraging retention; manage dilution. | ||||
| Characteristics: | Annual RSUs vest annually over a three-year period, subject to continued service with us, and become more valuable as our | ||||
| NEO | FY22 Salary ($)(1) | FY23 Salary ($)(1) | Salary Increase (%) | Primary Reasons for the Change | ||||||||||
| Oleg Khaykin | 875,000 | 900,000 | 2.9 | Retention considerations; market competitiveness; prior performance | ||||||||||
| Henk Derksen | 510,000 | 525,000 | 2.9 | Market competitiveness; prior performance; alignment with offer taking into consideration new hire equity awards granted in FY21. | ||||||||||
| Paul McNab | 435,000 | 450,000 | 3.4 | Internal pay equity; market competitiveness; prior performance | ||||||||||
| Luke Scrivanich | 390,000 | 400,000 | 2.6 | Internal pay equity; market competitiveness; prior performance | ||||||||||
| Gary Staley | 400,000 | 420,000 | 5.0 | Internal pay equity; market competitiveness; prior performance | ||||||||||
Named Executive Officer | Fiscal Year 2019 Base Salary | Fiscal Year 2020 Base Salary | Percentage Increase |
| Oleg Khaykin | 800,000 | 800,000 | — |
| Amar Maletira | 500,000 | 500,000 | — |
| Paul McNab | 435,000 | 435,000 | — |
| Luke Scrivanich | 372,000 | 372,000 | — |
| Gary Staley | 375,000 | 375,000 | — |
| ANNUAL CASH INCENTIVES | ||
| VPP Award Opportunities | ||
| Compensation Discussion and Analysis | ||
| NEO | FY23 Target Annual Cash Incentive Award Opportunity (% of Earned Base Salary) | ||||
| Oleg Khaykin | 125% | ||||
| Henk Derksen | 100% | ||||
| Paul McNab | 85% | ||||
| Luke Scrivanich | 85% | ||||
| Gary Staley | 85% | ||||
Named Executive Officer | Type of Executive VPP | Fiscal Year 2019 Target Incentive Opportunity | Fiscal Year 2020 Target Incentive Opportunity | Percentage Point Increase | |
| Oleg Khaykin | Corporate VPP | 120 | 120 | — | |
| Amar Maletira | Corporate VPP | 85 | 100 | 15% | (1) |
| Paul McNab | NSE VPP | 85 | 85 | — | |
| Luke Scrivanich | OSP VPP | 85 | 85 | — | |
| Gary Staley | NSE Sales VPP | 75 | 85 | 10% | (1) |
| Rationale | ||||||||
| GAAP revenue | Revenue as calculated in accordance with GAAP. | Incentivizes revenue growth and | ||||||
| Non-GAAP operating profit | GAAP operating income, excluding stock-based compensation, change in fair value of | Ensure appropriate investment to drive growth and support operating effectiveness. | ||||||
| NSE Sales | A valid purchase order, subject to the Viavi Order Acceptance Policy, for an eligible Viavi NSE product which has been entered in the Viavi financial books. | Incentivizes future revenue growth. | ||||||
| Compensation Discussion and Analysis | ||
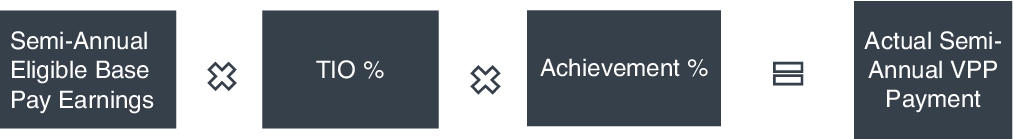
| Payout Formula | ||||||||||||||||||||
| H1 Financial Objectives | = | Base Salary for Period | x | Target Annual Cash Incentive Award Opportunity (% of Earned Base Salary) | x | Financial Metric Attainment % (100% weighting) | ||||||||||||||
| H2 Financial Objectives | ||||||||||||||||||||
Corporate VPP (Participants: Messrs. Khaykin and Derksen) | |||||||||||||||||||||||||||||||||||||||||
| H1 FY23 | H2 FY23 | ||||||||||||||||||||||||||||||||||||||||
| Goal | Weighting | Threshold | 50% | 100% | 150% | Results | Payout | Threshold | 50% | 100% | 150% | Results | Payout | ||||||||||||||||||||||||||||
Consolidated Revenue (in millions) | 50% | 611 | 649 | 682 | 709 | 589 | 0% | 624 | 662 | 695 | 723 | 504 | 0% | ||||||||||||||||||||||||||||
Consolidated Non-GAAP Operating Profit (in millions) | 50% | 128 | 152 | 173 | 190 | 111 | 0% | 128 | 153 | 173 | 190 | 57 | 0% | ||||||||||||||||||||||||||||
OSP VPP (Participant: Mr. Scrivanich) | |||||||||||
| Goal | Weighting | H1 FY23 Percentage of Achievement Against Target (1) | H2 FY23 Percentage of Achievement Against Target(1) | ||||||||
| OSP Revenue | 50% | 0% | 0% | ||||||||
| OSP Non- GAAP Operating Profit | 50% | 23% | 0% | ||||||||
NSE VPP (Participant: Mr. | |||||||||||
| Goal | Weighting | H1 FY23 Percentage of Achievement Against Target (1) | H2 FY23 Percentage of Achievement Against Target(1) | ||||||||
| NSE | 50% | 0% | 0% | ||||||||
| NSE | 50% | 0% | 0% | ||||||||
| H1 FY20 VPP Achievement | H2 FY20 VPP Achievement | |||||||
| NSE | NSE Sales | OSP | Corporate | NSE | NSE Sales | OSP | Corporate | |
| 128% | 119% | 86% | 107% | 20% | 25% | 42% | 31% | |
| Compensation Discussion and | ||
NSE Sales VPP (Participant: Mr. Staley) | |||||||||||
| Goal | Weighting | H1 FY23 Percentage of Achievement Against Target (1) | H2 FY23 Percentage of Achievement Against Target(1) | ||||||||
| NSE Revenue | 40% | 0% | 0% | ||||||||
| NSE Non-GAAP Operating | 20% | 0% | 0% | ||||||||
| Profit NSE Sales | 40% | 0% | 70% | ||||||||
Named Executive Officer | Time-Based RSU Awards (Target # of shares) | MSU Awards (Target # of shares) | Target Value of Equity Award (1) |
| Oleg Khaykin | 194,350 | 194,350 | 5,301,868 |
| Amar Maletira | 95,000 | 95,000 | 2,591,600 |
| Paul McNab | 35,000 | 35,000 | 954,800 |
| Luke Scrivanich | 30,000 | 30,000 | 818,400 |
| Gary Staley | 37,500 | 37,500 | 1,023,000 |
| Compensation Discussion and Analysis | ||
| NEO | MSU Shares (Target # of shares) | Time-Based RSU Awards (Target # of Shares) | Grant Date Fair Value of Equity Awards ($) | ||||||||
| Oleg Khaykin | 255,244 | 255,244 | 8,078,473 | ||||||||
| Henk Derksen | 69,930 | 69,930 | 2,213,285 | ||||||||
| Paul McNab | 29,720 | 29,720 | 940,638 | ||||||||
| Luke Scrivanich | 31,468 | 31,468 | 995,962 | ||||||||
| Gary Staley | 34,965 | 34,965 | 1,106,642 | ||||||||
| Initial Target Dollar Value for Annual Equity Awards of all NEOs | ||||||||||||||
| NEO | FY23 Approved Target Dollar Value ($) | FY22 Approved Target Dollar Value ($) | Difference from FY22 (%) | Primary Reasons for the Change | ||||||||||
| Oleg Khaykin | 7,300,000 | 7,000,000 | +4.3 | % | Retention; market competitiveness; prior performance | |||||||||
| Henk Derksen | 2,000,000 | 1,000,000 | +100 | % | Market competitiveness; prior performance; alignment with offer letter terms. | |||||||||
| Paul McNab | 850,000 | 850,000 | 0 | % | N/A | |||||||||
| Luke Scrivanich | 900,000 | 900,000 | 0 | % | N/A | |||||||||
| Gary Staley | 1,000,000 | 1,000,000 | 0 | % | N/A | |||||||||
| Compensation Discussion and Analysis | ||
Performance
Each earned unit converts into one share of common stock on the vesting date. 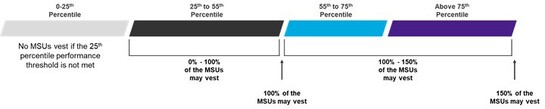 MSUs Earned in FY23 | |||||||||||||||||||||||||||||||||||||||
| MSUs Earned in FY23 | Measurement Period | Measurement Period Ranking | ||||||
FY20 MSUs: 108.25% of 3rd tranche earned | 8/1/19 to 9/15/19 vs 8/1/22 to 9/15/22 | 58.3 percentile TSR ranking | ||||||
FY21 MSUs: 145.00% of 2nd tranche earned | 8/1/20 to 9/15/20 vs 8/1/22 to 9/15/22 | 73.0 percentile TSR ranking | ||||||
FY22 MSUs: 146.00% of 1st tranche earned | 8/1/21 to 9/15/21 vs 8/1/22 to 9/15/22 | 73.4 percentile TSR ranking | ||||||
FY21 CFO MSUs: 139.25% of 2nd tranche earned (2) | 3/15/21 to 4/28/21 vs 8/1/22 to 9/15/22 | 70.7 percentileTSR ranking | ||||||
| Compensation Discussion and Analysis | ||
| NEO | FY20 MSUs # of Shares Earned | FY21MSUs # of Shares Earned | FY22 MSUs # of Shares Earned | ||||||||
| Oleg Khaykin | 70,129 | 127,383 | 101,028 | ||||||||
| Henk Derksen | — | 31,899 | 14,432 | ||||||||
| Paul McNab | 12,630 | 14,558 | 12,268 | ||||||||
| Luke Scrivanich | 10,825 | 15,468 | 12,990 | ||||||||
| Gary Staley | 13,531 | 18,198 | 14,432 | ||||||||
| General Health, Welfare and Other Benefit Plans | Perquisites and Other Benefits | |||||||
Named Executive Officer | FY 2016 MSUs # of Shares Earned | FY 2017 MSUs # of Shares Earned | FY 2018 MSUs # of Shares Earned | FY 2019 MSUs # of Shares Earned |
| Oleg Khaykin | 43,329 | 28,704 | 71,250 | 103,211 |
| Amar Maletira | 71,592 | 25,001 | 29,449 | 35,000 |
| Paul McNab | ___ | 16,251 | 12,825 | 15,000 |
| Luke Scrivanich | ___ | 15,000 | 12,825 | 15,000 |
| Gary Staley | ___ | ___ | 23,386(1) | 15,000 |
| Compensation Discussion and Analysis | ||
| Name of Plan | Material Features | |||||||||||||||||||||||||
| Executive Change of Control Benefits Plan (Covers all NEOs | ▪“Double-trigger” provisions to preserve morale and productivity, encourage executive retention to maintain the stability of our business during a change of control and protect executive officers in the event of job loss. ▪A departing executive officer must sign a separation and release agreement acceptable to us as ▪Provides for benefits comparable to benefits offered by members of our compensation peer group, which helps us attract talented executive officers and maintain a consistent management team. | |||||||||||||||||||||||||
| CEO Employment Agreement | ▪Limited severance payments and benefits outside of a change in control and “double trigger” provision in the ▪Our CEO must sign a separation and release agreement acceptable to us as a condition to receiving post-employment compensation payments or ▪Provides for benefits comparable to benefits offered by members of our compensation peer group. | |||||||||||||||||||||||||
CFO Employment Agreement2 | ▪Limited payments and severance benefits outside of a change in control. ▪Our CFO must sign a separation and release agreement acceptable to us as a condition to receiving post-employment compensation payments or ▪Provides for benefits comparable to benefits offered by members of | |||||||||||||||||||||||||
| Equity Plan Awards | ▪Consistent with the practice of many of our compensation peers and to encourage our executive officers and | |||||||||||||||||||||||||
| Compensation Discussion and Analysis | ||
| Policy | Considerations | Material Features | ||||||
| Anti-Hedging Policy | ▪Hedging insulates executive officers from stock price movement and reduces alignment with | ▪Pursuant to our | ||||||
| Anti-Pledging Policy | ▪Pledging raises potential risks to stockholder value, particularly if the pledge is significant. | ▪Our insider trading policy prohibits Board members, employees (including executive officers), contractors and consultants of VIAVI and its subsidiaries, and their immediate family members, co-inhabitants, and controlled parties from holding our securities in margin accounts | ||||||
| Equity Grant Timing Policy | ▪Equity award grants should not be timed to take advantage of the release of material | ▪New-hire, retention, ▪We do not time the release of material nonpublic information for the purpose of affecting the value of executive compensation, nor do we time the grant of equity awards | ||||||
| Burn Rate Policy | ||||||||
| Stock Ownership Policy | ▪Stock ownership among our executive officers and | |||||||
| Clawback Policy | ▪We should be able to recoup cash and | ▪The Compensation Committee has sole discretion under the policy, consistent with any applicable statutory requirements, to seek reimbursement, holdback, and/or “clawback” cash and equity compensation awards in ▪The SEC and Nasdaq recently adopted long-awaited final rules implementing the incentive-based compensation recovery provisions of the | ||||||
| Compensation Discussion and Analysis | ||
| ROLE OF COMPENSATION COMMITTEE AND BOARD | ▪The Compensation Committee is responsible for determining the ▪The Board determines the compensation of our CEO based on the recommendations of the Compensation Committee. | ||||
| ROLE OF COMPENSATION COMMITTEE CONSULTANT | ▪The Compensation Committee directly retained the services of Compensia, Inc. (“Compensia”) as its compensation consultant for FY23. ▪The Compensation Committee conducts an annual assessment of its consultant’s performance and independence and, based on its assessment, determines whether to re-appoint its consultant each year. ▪In FY23, the Compensation Committee assessed the independence of Compensia pursuant to the Nasdaq Listing Standards and SEC rules and concluded that Compensia is independent and that no conflict of interest has arisen or will arise that would prevent Compensia from serving as an independent consultant to the Compensation Committee. ▪In FY23, the services provided by Compensia included: ◦Assisting in the selection of our compensation peer group companies for FY24 (and with the determination of our FY23 compensation peer group in FY22; ◦Collecting and analyzing compensation market data drawn from companies that the Compensation Committee selected as a “peer group” of technology companies, as well as a broader set of competitive market data based on the Radford Global Technology Survey; ◦Helping the Compensation Committee interpret and understand the compensation market data; ◦Assisting in the review of recent governance trends for potential policy updates; ◦Advising on the reasonableness of our NEO and senior management’s compensation levels and programs; ◦Assisting in the review of non-employee Director compensation, including providing compensation market data; ◦Assisting in the review of the NEO compensation disclosure in this Proxy Statement; ◦Conducting a detailed review of our cash and equity compensation plans to provide an independent view of the risks associated with our compensation programs, including those for our NEOs and any other employees; and ◦Attending each Compensation Committee meeting, including meeting with the Compensation Committee in private sessions, without any members of senior management present. | ||||
| ROLE OF MANAGEMENT | ▪The Compensation Committee discusses NEO performance assessments and compensation targets with our Board chair and our Senior Vice President, Human Resources. ▪To assess our CEO’s performance, the Compensation Committee oversees a comprehensive assessment process including feedback from the Board and members of senior management and is facilitated by our Senior Vice President, Human Resources. ▪We also have an executive compensation team that provides background on company budgetary constraints and internal pay comparisons to help the Compensation Committee understand Compensia’s recommendations in those contexts. NEOs are not present for Compensation Committee decisions related to their individual compensation. | ||||
| Compensation Discussion and Analysis | ||
| FY22 Peer Group | |||||
| 3D Systems Corporation | National Instruments Corporation | ||||
| Ciena Corporation | NETGEAR, Inc. | ||||
| Cirrus Logic, Inc. | NetScout Systems, Inc. | ||||
| Coherent | OSI Systems, Inc. | ||||
| Commvault Systems, Inc. | Plantronics, Inc. | ||||
| Extreme Networks, Inc. | Silicon Laboratories Inc. | ||||
| F5, Inc. | SunPower Corporation | ||||
| Infinera Corporation | Synaptics Incorporated | ||||
| Knowles Corporation | Ubiquiti Inc. | ||||
| Lumentum Holdings Inc. | Viasat, Inc. | ||||
| MKS Instruments, Inc. | Wolfspeed, Inc. (formerly Cree, Inc.) | ||||
| Compensation Discussion and Analysis | ||
| Category | Ownership Requirement | Deadline for Compliance | ||||||
| Non-Employee Directors | 3x annual cash retainer | 5th anniversary of election to the Board | ||||||
| Chief Executive Officer | 3x annual base salary | 5th anniversary of hire or promotion date | ||||||
| Executive Officers (excluding CEO) | 1x annual base salary | 5th anniversary of hire or promotion date | ||||||
| Compensation Discussion and Analysis | ||
| Risk Assessment Factors | |||||
| The Compensation Committee considered the following, among other factors, when determining the level of risk: | |||||
| Pay Mix and Base Salary | ■Target annual cash incentive award opportunities are not over weighted ■Mix of cash and equity compensation is aligned with market ■Compensation is balanced, with potential for increased rewards based on company performance ■Use of MSUs provides performance alignment with stockholders | ||||
| Base Salary | ■Non-executive base salaries are targeted within market range ◦Exceptions are managed via approval process ◦Executive base salaries are based on market data and competitive factors | ||||
| Executive Annual Cash Incentive Award | ■Different plans for top executives, sales employees and all other employees to develop goals that optimize the incentive to each population ■Sliding scale of payouts from threshold up to maximum to avoid binary outcomes ■Multiple performance metrics that are aligned to business strategy to focus executives on the appropriate actions ■Semi-annual performance targets address forecasting issues with longer (annual) time periods ■Combination of organization, business group and individual goals can incentivize and reward employees for both group and personal performance | ||||
| Cash and equity incentive awards | ■Review of sales contracts by employees not dependent on commissions and review of calculation of commissions of employees that do not report to the sales department ■Two review groups to ensure proper functioning of the sales incentive program ■Clear documentation to help ensure the uniform treatment of all sales employees and assist | ||||
| Equity Incentive Awards | ■Equity awards, including the use of MSUs, promote alignment between executive and ■Equity awards are generally within the market norms and the Compensation Committee ■Mix of spending between NEOs and the general employee population within market norms | ||||
| Stock Ownership Guidelines and Trading Policies | ■Three-year vesting helps to ■Stock ownership requirements are aligned with | ||||
| Clawback Policy | ■Clawback Policy that applies to | ||||
| Severance and | ■Benefit levels and | ||||
| Name and Principal Position | Year | Salary ($) | Bonus ($) | Stock Awards ($) (1) | Non-Equity Incentive Plan Compensation ($) (2) | All Other Compensation ($) (3) | Total ($) | ||||||||||||||||
| Oleg Khaykin President and Chief Executive Officer | 2023 | 895,192 | — | 8,078,473 | — | 5,000 | 8,978,665 | ||||||||||||||||
| 2022 | 849,038 | — | 7,548,009 | 938,369 | 5,000 | 9,340,416 | |||||||||||||||||
| 2021 | 800,000 | — | 15,169,727 | 894,281 | 4,000 | 16,868,008 | |||||||||||||||||
Henk Derksen Executive Vice President and Chief Financial Officer (4) | 2023 | 522,115 | — | 2,213,285 | — | — | 2,735,400 | ||||||||||||||||
| 2022 | 510,000 | — | 1,078,256 | 466,977 | — | 2,055,233 | |||||||||||||||||
| 2021 | 137,308 | 200,000 | 3,572,692 | 128,120 | 80,000 | 4,118,120 | |||||||||||||||||
| Paul McNab Executive Vice President and Chief Marketing & Strategy Officer | 2023 | 447,116 | — | 940,638 | — | — | 1,387,754 | ||||||||||||||||
| 2022 | 435,000 | — | 916,527 | 388,337 | — | 1,739,864 | |||||||||||||||||
| 2021 | 435,000 | — | 1,728,750 | 171,227 | — | 2,334,977 | |||||||||||||||||
| Luke Scrivanich Senior Vice President and General Manager, Optical Security & Performance Products (OSP) | 2023 | 398,077 | — | 995,962 | 19,362 | 5,000 | 1,418,401 | ||||||||||||||||
| 2022 | 383,769 | — | 970,448 | 257,847 | 5,000 | 1,617,064 | |||||||||||||||||
| 2021 | 372,000 | — | 1,782,887 | 442,680 | 4,000 | 2,601,567 | |||||||||||||||||
| Gary Staley Senior Vice President, Global Sales, Network Enablement and Service Enablement | 2023 | 416,154 | — | 1,106,642 | 49,980 | 5,000 | 1,577,776 | ||||||||||||||||
| 2022 | 391,346 | — | 1,078,256 | 343,016 | 5,000 | 1,817,618 | |||||||||||||||||
| 2021 | 375,000 | — | 2,160,967 | 150,884 | 4,000 | 2,690,851 | |||||||||||||||||
| Executive Compensation and | ||
| Name | Fiscal Year | Maximum Possible Value of MSUs Using Grant Date Fair Value | ||||||
| Oleg Khaykin | 2023 | 6,547,009 | ||||||
| 2022 | 6,131,200 | |||||||
| 2021 | 6,143,444 | |||||||
| Henk Derksen | 2023 | 1,793,705 | ||||||
| 2022 | 875,860 | |||||||
| 2021 | 2,949,602 | |||||||
| Paul McNab | 2023 | 762,318 | ||||||
| 2022 | 744,489 | |||||||
| 2021 | 702,097 | |||||||
| Luke Scrivanich | 2023 | 807,154 | ||||||
| 2022 | 788,289 | |||||||
| 2021 | 745,990 | |||||||
| Gary Staley | 2023 | 896,852 | ||||||
| 2022 | 875,860 | |||||||
| 2021 | 1,333,270 | |||||||
| Executive Compensation and | ||
| GRANTS OF PLAN BASED AWARDS | ||||||||||||||||||||||||||||||||||||||
Estimated Future Payouts Under Non- Equity Incentive Plan Awards (1) | Estimated Future Payouts Under Equity Incentive Plan Awards(2) | All Other Stock Awards: | ||||||||||||||||||||||||||||||||||||
| Name | Grant Date | Approval Date | Award Type | Threshold ($) | Target ($) | Maximum ($) | Threshold (#) | Target (#) | Maximum (#) | Number of Shares of Stock (#) | Grant Date Fair Value of Stock Awards(3) ($) | |||||||||||||||||||||||||||
| Oleg Khaykin | 8/28/2022 | 8/17/2022 | MSUs | 0 | 255,244 | 382,866 | 4,364,672 | |||||||||||||||||||||||||||||||
| 8/28/2022 | 8/17/2022 | RSUs | 255,244 | (4) | 3,713,800 | |||||||||||||||||||||||||||||||||
| N/A | N/A | Cash | 0 | 1,125,000 | 1,687,500 | |||||||||||||||||||||||||||||||||
| Incentive | ||||||||||||||||||||||||||||||||||||||
| Henk Derksen | 8/28/2022 | 8/17/2022 | MSUs | 0 | 69,930 | 104,895 | 1,195,803 | |||||||||||||||||||||||||||||||
| 8/28/2022 | 8/17/2022 | RSUs | 0 | 69,930 | (4) | 1,017,482 | ||||||||||||||||||||||||||||||||
| N/A | N/A | Cash | 0 | 525,000 | 787,500 | |||||||||||||||||||||||||||||||||
| Incentive | ||||||||||||||||||||||||||||||||||||||
| Paul McNab | 8/28/2022 | 8/17/2022 | MSUs | 0 | 29,720 | 44,580 | 508,212 | |||||||||||||||||||||||||||||||
| 8/28/2022 | 8/17/2022 | RSUs | 29,720 | (4) | 432,426 | |||||||||||||||||||||||||||||||||
| N/A | N/A | Cash | 0 | 382,500 | 573,750 | |||||||||||||||||||||||||||||||||
| Incentive | ||||||||||||||||||||||||||||||||||||||
| Luke Scrivanich | 8/28/2022 | 8/17/2022 | MSUs | 0 | 31,468 | 47,202 | 538,103 | |||||||||||||||||||||||||||||||
| 8/28/2022 | 8/17/2022 | RSUs | 31,468 | (4) | 457,859 | |||||||||||||||||||||||||||||||||
| N/A | N/A | Cash | 0 | 340,000 | 510,000 | |||||||||||||||||||||||||||||||||
| Incentive | ||||||||||||||||||||||||||||||||||||||
| Gary Staley | 8/28/2022 | 8/17/2022 | MSUs | 0 | 34,965 | 52,448 | 597,902 | |||||||||||||||||||||||||||||||
| 8/28/2022 | 8/17/2022 | RSUs | 34,965 | (4) | 508,741 | |||||||||||||||||||||||||||||||||
| N/A | N/A | Cash | 0 | 357,000 | 678,300 | |||||||||||||||||||||||||||||||||
| Incentive | ||||||||||||||||||||||||||||||||||||||
| Executive Compensation and | ||
| OUTSTANDING EQUITY AWARDS AT FISCAL YEAR-END OPTION AWARDS | STOCK AWARDS | ||||||||||||||||||||||||||||||||||
| Equity Incentive Plan Awards: | Equity Incentive Plan Awards: | ||||||||||||||||||||||||||||||||||
| Name | Grant Date | Number of Securities Underlying Unexercised Options (#) Exercisable | Number of Securities Underlying Unexercised Options (#) Unexercisable | Option Exercise Price ($) | Option Expiration Date | Number of Shares or Units of Stock That Have Not Vested (#) | Market Value of Shares or Units of Stock That Have Not Vested ($)(1) | Number of Unearned Shares, Units or Other Rights That Have Not Vested (#) | Market or Payout Value of Unearned Shares, Units or Other Rights That Have Not Vested ($)(1) | ||||||||||||||||||||||||||
| Oleg Khaykin | 2/15/2016 | 1,180,257(2) | 5.95 | 2/15/2024 | |||||||||||||||||||||||||||||||
| 8/28/2020 | 87,852 | (3) | 995,363 | ||||||||||||||||||||||||||||||||
| 2/28/2021 | 245,000 | (4) | 2,775,850 | ||||||||||||||||||||||||||||||||
| 2/28/2021 | 122,500 | (5) | 1,387,925 | ||||||||||||||||||||||||||||||||
| 8/28/2021 | 138,394 | 1,568,004 | |||||||||||||||||||||||||||||||||
| 8/28/2022 | 255,244 | (6) | 2,891,915 | ||||||||||||||||||||||||||||||||
| 8/28/2020 | 131,778 | (7) | 1,493,045 | ||||||||||||||||||||||||||||||||
| 2/28/2021 | 122,500 | (8) | 1,387,925 | ||||||||||||||||||||||||||||||||
| 8/28/2021 | 207,591 | (7) | 2,352,006 | ||||||||||||||||||||||||||||||||
| 8/28/2022 | 255,244 | (7) | 2,891,915 | ||||||||||||||||||||||||||||||||
| Henk Derksen | 5/28/2021 | 45,815 | (9) | 519,084 | |||||||||||||||||||||||||||||||
| 8/28/2021 | 19,770 | (6) | 223,994 | ||||||||||||||||||||||||||||||||
| 8/28/2022 | 69,930 | (3) | 792,307 | ||||||||||||||||||||||||||||||||
| 5/28/2021 | 68,723 | (10) | 778,626 | ||||||||||||||||||||||||||||||||
| 8/28/2021 | 29,655 | (7) | 582,276 | ||||||||||||||||||||||||||||||||
| 8/28/2022 | 69,930 | (7) | 792,307 | ||||||||||||||||||||||||||||||||
| Paul McNab | 8/28/2020 | 10,040 | (3) | 113,753 | |||||||||||||||||||||||||||||||
| 2/28/2021 | 30,000 | (4) | 339,900 | ||||||||||||||||||||||||||||||||
| 8/28/2021 | 16,805 | (6) | 190,401 | ||||||||||||||||||||||||||||||||
| 8/28/2022 | 29,720 | (3) | 336,728 | ||||||||||||||||||||||||||||||||
| 8/28/2020 | 15,060 | (7) | 170,630 | ||||||||||||||||||||||||||||||||
| 2/28/2021 | 30,000 | (8) | 339,900 | ||||||||||||||||||||||||||||||||
| 8/28/2021 | 25,207 | (7) | 285,595 | ||||||||||||||||||||||||||||||||
| 8/28/2022 | 29,720 | (7) | 335,991 | ||||||||||||||||||||||||||||||||
| Luke Scrivanich | 8/28/2020 | 10,668 | (3) | 120,868 | |||||||||||||||||||||||||||||||
| 2/28/2021 | 30,000 | (4) | 339,900 | ||||||||||||||||||||||||||||||||
| 8/28/2021 | 17,794 | (6) | 201,606 | ||||||||||||||||||||||||||||||||
| 8/28/2022 | 31,468 | (3) | 356,532 | ||||||||||||||||||||||||||||||||
| 8/28/2020 | 16,002 | (7) | 181,303 | ||||||||||||||||||||||||||||||||
| 2/28/2021 | 30,000 | (8) | 339,900 | ||||||||||||||||||||||||||||||||
| 8/28/2021 | 26,690 | (7) | 302,392 | ||||||||||||||||||||||||||||||||
| 8/28/2022 | 31,468 | (7) | 356,532 | ||||||||||||||||||||||||||||||||
| Gary Staley | 8/28/2020 | 12,551 | (3) | 142,203 | |||||||||||||||||||||||||||||||
| 2/28/2021 | 37,500 | (4) | 424,875 | ||||||||||||||||||||||||||||||||
| 8/28/2021 | 19,770 | (6) | 223,994 | ||||||||||||||||||||||||||||||||
| 8/28/2022 | 34,965 | (3) | 396,153 | ||||||||||||||||||||||||||||||||
| 8/28/2020 | 18,827 | (7) | 213,304 | ||||||||||||||||||||||||||||||||
| 2/28/2021 | 37,500 | (8) | 424,875 | ||||||||||||||||||||||||||||||||
| 8/28/2021 | 29,655 | (7) | 335,991 | ||||||||||||||||||||||||||||||||
| 8/28/2022 | 34,965 | (7) | 396,153 | ||||||||||||||||||||||||||||||||
| Executive Compensation and | ||
| Executive Compensation and | ||
| OPTION EXERCISES AND STOCK VESTED | ||||||||||||||
| OPTION AWARDS | STOCK AWARDS | |||||||||||||
| Name | Number of Shares Acquired on Exercise (#) | Value Realized on Exercise ($) | Number of Shares Acquired on Vesting (#) | Value Realized on Vesting ($) (1) | ||||||||||
| Oleg Khaykin | — | — | 471,865 | 6,489,475 | ||||||||||
| Henk Derksen | — | — | 79,124 | 883,698 | ||||||||||
| Paul McNab | — | — | 60,830 | 835,362 | ||||||||||
| Luke Scrivanich | — | — | 61,360 | 843,291 | ||||||||||
| Gary Staley | — | — | 71,737 | 985,610 | ||||||||||
| Executive Compensation and Other Information | ||
| Khaykin Agreement | ||
| Executive Compensation and Other Information | ||
| Derksen Agreement | ||
| Executive Compensation and Other Information | ||
| Name and Principal Position | Year | Salary ($) | Bonus ($) | Stock Awards ($) (1) | Non-Equity Incentive Plan Compensation ($) (2) | All Other Compensation ($) (3) | Total ($) | ||||||||||||||||
| Oleg Khaykin President and Chief Executive Officer | 2023 | 895,192 | — | 8,078,473 | — | 5,000 | 8,978,665 | ||||||||||||||||
| 2022 | 849,038 | — | 7,548,009 | 938,369 | 5,000 | 9,340,416 | |||||||||||||||||
| 2021 | 800,000 | — | 15,169,727 | 894,281 | 4,000 | 16,868,008 | |||||||||||||||||
Henk Derksen Executive Vice President and Chief Financial Officer (4) | 2023 | 522,115 | — | 2,213,285 | — | — | 2,735,400 | ||||||||||||||||
| 2022 | 510,000 | — | 1,078,256 | 466,977 | — | 2,055,233 | |||||||||||||||||
| 2021 | 137,308 | 200,000 | 3,572,692 | 128,120 | 80,000 | 4,118,120 | |||||||||||||||||
| Paul McNab Executive Vice President and Chief Marketing & Strategy Officer | 2023 | 447,116 | — | 940,638 | — | — | 1,387,754 | ||||||||||||||||
| 2022 | 435,000 | — | 916,527 | 388,337 | — | 1,739,864 | |||||||||||||||||
| 2021 | 435,000 | — | 1,728,750 | 171,227 | — | 2,334,977 | |||||||||||||||||
| Luke Scrivanich Senior Vice President and General Manager, Optical Security & Performance Products (OSP) | 2023 | 398,077 | — | 995,962 | 19,362 | 5,000 | 1,418,401 | ||||||||||||||||
| 2022 | 383,769 | — | 970,448 | 257,847 | 5,000 | 1,617,064 | |||||||||||||||||
| 2021 | 372,000 | — | 1,782,887 | 442,680 | 4,000 | 2,601,567 | |||||||||||||||||
| Gary Staley Senior Vice President, Global Sales, Network Enablement and Service Enablement | 2023 | 416,154 | — | 1,106,642 | 49,980 | 5,000 | 1,577,776 | ||||||||||||||||
| 2022 | 391,346 | — | 1,078,256 | 343,016 | 5,000 | 1,817,618 | |||||||||||||||||
| 2021 | 375,000 | — | 2,160,967 | 150,884 | 4,000 | 2,690,851 | |||||||||||||||||
| Executive Compensation and Other Information | ||
| Name | Fiscal Year | Maximum Possible Value of MSUs Using Grant Date Fair Value | ||||||
| Oleg Khaykin | 2023 | 6,547,009 | ||||||
| 2022 | 6,131,200 | |||||||
| 2021 | 6,143,444 | |||||||
| Henk Derksen | 2023 | 1,793,705 | ||||||
| 2022 | 875,860 | |||||||
| 2021 | 2,949,602 | |||||||
| Paul McNab | 2023 | 762,318 | ||||||
| 2022 | 744,489 | |||||||
| 2021 | 702,097 | |||||||
| Luke Scrivanich | 2023 | 807,154 | ||||||
| 2022 | 788,289 | |||||||
| 2021 | 745,990 | |||||||
| Gary Staley | 2023 | 896,852 | ||||||
| 2022 | 875,860 | |||||||
| 2021 | 1,333,270 | |||||||
| Executive Compensation and Other Information | ||
| GRANTS OF PLAN BASED AWARDS | ||||||||||||||||||||||||||||||||||||||
Estimated Future Payouts Under Non- Equity Incentive Plan Awards (1) | Estimated Future Payouts Under Equity Incentive Plan Awards(2) | All Other Stock Awards: | ||||||||||||||||||||||||||||||||||||
| Name | Grant Date | Approval Date | Award Type | Threshold ($) | Target ($) | Maximum ($) | Threshold (#) | Target (#) | Maximum (#) | Number of Shares of Stock (#) | Grant Date Fair Value of Stock Awards(3) ($) | |||||||||||||||||||||||||||
| Oleg Khaykin | 8/28/2022 | 8/17/2022 | MSUs | 0 | 255,244 | 382,866 | 4,364,672 | |||||||||||||||||||||||||||||||
| 8/28/2022 | 8/17/2022 | RSUs | 255,244 | (4) | 3,713,800 | |||||||||||||||||||||||||||||||||
| N/A | N/A | Cash | 0 | 1,125,000 | 1,687,500 | |||||||||||||||||||||||||||||||||
| Incentive | ||||||||||||||||||||||||||||||||||||||
| Henk Derksen | 8/28/2022 | 8/17/2022 | MSUs | 0 | 69,930 | 104,895 | 1,195,803 | |||||||||||||||||||||||||||||||
| 8/28/2022 | 8/17/2022 | RSUs | 0 | 69,930 | (4) | 1,017,482 | ||||||||||||||||||||||||||||||||
| N/A | N/A | Cash | 0 | 525,000 | 787,500 | |||||||||||||||||||||||||||||||||
| Incentive | ||||||||||||||||||||||||||||||||||||||
| Paul McNab | 8/28/2022 | 8/17/2022 | MSUs | 0 | 29,720 | 44,580 | 508,212 | |||||||||||||||||||||||||||||||
| 8/28/2022 | 8/17/2022 | RSUs | 29,720 | (4) | 432,426 | |||||||||||||||||||||||||||||||||
| N/A | N/A | Cash | 0 | 382,500 | 573,750 | |||||||||||||||||||||||||||||||||
| Incentive | ||||||||||||||||||||||||||||||||||||||
| Luke Scrivanich | 8/28/2022 | 8/17/2022 | MSUs | 0 | 31,468 | 47,202 | 538,103 | |||||||||||||||||||||||||||||||
| 8/28/2022 | 8/17/2022 | RSUs | 31,468 | (4) | 457,859 | |||||||||||||||||||||||||||||||||
| N/A | N/A | Cash | 0 | 340,000 | 510,000 | |||||||||||||||||||||||||||||||||
| Incentive | ||||||||||||||||||||||||||||||||||||||
| Gary Staley | 8/28/2022 | 8/17/2022 | MSUs | 0 | 34,965 | 52,448 | 597,902 | |||||||||||||||||||||||||||||||
| 8/28/2022 | 8/17/2022 | RSUs | 34,965 | (4) | 508,741 | |||||||||||||||||||||||||||||||||
| N/A | N/A | Cash | 0 | 357,000 | 678,300 | |||||||||||||||||||||||||||||||||
| Incentive | ||||||||||||||||||||||||||||||||||||||
| Executive Compensation and Other Information | ||
| OUTSTANDING EQUITY AWARDS AT FISCAL YEAR-END OPTION AWARDS | STOCK AWARDS | ||||||||||||||||||||||||||||||||||
| Equity Incentive Plan Awards: | Equity Incentive Plan Awards: | ||||||||||||||||||||||||||||||||||
| Name | Grant Date | Number of Securities Underlying Unexercised Options (#) Exercisable | Number of Securities Underlying Unexercised Options (#) Unexercisable | Option Exercise Price ($) | Option Expiration Date | Number of Shares or Units of Stock That Have Not Vested (#) | Market Value of Shares or Units of Stock That Have Not Vested ($)(1) | Number of Unearned Shares, Units or Other Rights That Have Not Vested (#) | Market or Payout Value of Unearned Shares, Units or Other Rights That Have Not Vested ($)(1) | ||||||||||||||||||||||||||
| Oleg Khaykin | 2/15/2016 | 1,180,257(2) | 5.95 | 2/15/2024 | |||||||||||||||||||||||||||||||
| 8/28/2020 | 87,852 | (3) | 995,363 | ||||||||||||||||||||||||||||||||
| 2/28/2021 | 245,000 | (4) | 2,775,850 | ||||||||||||||||||||||||||||||||
| 2/28/2021 | 122,500 | (5) | 1,387,925 | ||||||||||||||||||||||||||||||||
| 8/28/2021 | 138,394 | 1,568,004 | |||||||||||||||||||||||||||||||||
| 8/28/2022 | 255,244 | (6) | 2,891,915 | ||||||||||||||||||||||||||||||||
| 8/28/2020 | 131,778 | (7) | 1,493,045 | ||||||||||||||||||||||||||||||||
| 2/28/2021 | 122,500 | (8) | 1,387,925 | ||||||||||||||||||||||||||||||||
| 8/28/2021 | 207,591 | (7) | 2,352,006 | ||||||||||||||||||||||||||||||||
| 8/28/2022 | 255,244 | (7) | 2,891,915 | ||||||||||||||||||||||||||||||||
| Henk Derksen | 5/28/2021 | 45,815 | (9) | 519,084 | |||||||||||||||||||||||||||||||
| 8/28/2021 | 19,770 | (6) | 223,994 | ||||||||||||||||||||||||||||||||
| 8/28/2022 | 69,930 | (3) | 792,307 | ||||||||||||||||||||||||||||||||
| 5/28/2021 | 68,723 | (10) | 778,626 | ||||||||||||||||||||||||||||||||
| 8/28/2021 | 29,655 | (7) | 582,276 | ||||||||||||||||||||||||||||||||
| 8/28/2022 | 69,930 | (7) | 792,307 | ||||||||||||||||||||||||||||||||
| Paul McNab | 8/28/2020 | 10,040 | (3) | 113,753 | |||||||||||||||||||||||||||||||
| 2/28/2021 | 30,000 | (4) | 339,900 | ||||||||||||||||||||||||||||||||
| 8/28/2021 | 16,805 | (6) | 190,401 | ||||||||||||||||||||||||||||||||
| 8/28/2022 | 29,720 | (3) | 336,728 | ||||||||||||||||||||||||||||||||
| 8/28/2020 | 15,060 | (7) | 170,630 | ||||||||||||||||||||||||||||||||
| 2/28/2021 | 30,000 | (8) | 339,900 | ||||||||||||||||||||||||||||||||
| 8/28/2021 | 25,207 | (7) | 285,595 | ||||||||||||||||||||||||||||||||
| 8/28/2022 | 29,720 | (7) | 335,991 | ||||||||||||||||||||||||||||||||
| Luke Scrivanich | 8/28/2020 | 10,668 | (3) | 120,868 | |||||||||||||||||||||||||||||||
| 2/28/2021 | 30,000 | (4) | 339,900 | ||||||||||||||||||||||||||||||||
| 8/28/2021 | 17,794 | (6) | 201,606 | ||||||||||||||||||||||||||||||||
| 8/28/2022 | 31,468 | (3) | 356,532 | ||||||||||||||||||||||||||||||||
| 8/28/2020 | 16,002 | (7) | 181,303 | ||||||||||||||||||||||||||||||||
| 2/28/2021 | 30,000 | (8) | 339,900 | ||||||||||||||||||||||||||||||||
| 8/28/2021 | 26,690 | (7) | 302,392 | ||||||||||||||||||||||||||||||||
| 8/28/2022 | 31,468 | (7) | 356,532 | ||||||||||||||||||||||||||||||||
| Gary Staley | 8/28/2020 | 12,551 | (3) | 142,203 | |||||||||||||||||||||||||||||||
| 2/28/2021 | 37,500 | (4) | 424,875 | ||||||||||||||||||||||||||||||||
| 8/28/2021 | 19,770 | (6) | 223,994 | ||||||||||||||||||||||||||||||||
| 8/28/2022 | 34,965 | (3) | 396,153 | ||||||||||||||||||||||||||||||||
| 8/28/2020 | 18,827 | (7) | 213,304 | ||||||||||||||||||||||||||||||||
| 2/28/2021 | 37,500 | (8) | 424,875 | ||||||||||||||||||||||||||||||||
| 8/28/2021 | 29,655 | (7) | 335,991 | ||||||||||||||||||||||||||||||||
| 8/28/2022 | 34,965 | (7) | 396,153 | ||||||||||||||||||||||||||||||||
| Executive Compensation and Other Information | ||
| Executive Compensation and Other Information | ||
| OPTION EXERCISES AND STOCK VESTED | ||||||||||||||
| OPTION AWARDS | STOCK AWARDS | |||||||||||||
| Name | Number of Shares Acquired on Exercise (#) | Value Realized on Exercise ($) | Number of Shares Acquired on Vesting (#) | Value Realized on Vesting ($) (1) | ||||||||||
| Oleg Khaykin | — | — | 471,865 | 6,489,475 | ||||||||||
| Henk Derksen | — | — | 79,124 | 883,698 | ||||||||||
| Paul McNab | — | — | 60,830 | 835,362 | ||||||||||
| Luke Scrivanich | — | — | 61,360 | 843,291 | ||||||||||
| Gary Staley | — | — | 71,737 | 985,610 | ||||||||||
| Executive Compensation and Other Information | ||
| Khaykin Agreement | ||
| Executive Compensation and Other Information | ||
| Derksen Agreement | ||
| Executive Compensation and Other Information | ||
| Name and Principal Position | Year | Salary ($) | Bonus ($) | Stock Awards ($) (1) | Non-Equity Incentive Plan Compensation ($) (2) | All Other Compensation ($) (3) | Total ($) | ||||||||||||||||
| Oleg Khaykin President and Chief Executive Officer | 2023 | 895,192 | — | 8,078,473 | — | 5,000 | 8,978,665 | ||||||||||||||||
| 2022 | 849,038 | — | 7,548,009 | 938,369 | 5,000 | 9,340,416 | |||||||||||||||||
| 2021 | 800,000 | — | 15,169,727 | 894,281 | 4,000 | 16,868,008 | |||||||||||||||||
Henk Derksen Executive Vice President and Chief Financial Officer (4) | 2023 | 522,115 | — | 2,213,285 | — | — | 2,735,400 | ||||||||||||||||
| 2022 | 510,000 | — | 1,078,256 | 466,977 | — | 2,055,233 | |||||||||||||||||
| 2021 | 137,308 | 200,000 | 3,572,692 | 128,120 | 80,000 | 4,118,120 | |||||||||||||||||
| Paul McNab Executive Vice President and Chief Marketing & Strategy Officer | 2023 | 447,116 | — | 940,638 | — | — | 1,387,754 | ||||||||||||||||
| 2022 | 435,000 | — | 916,527 | 388,337 | — | 1,739,864 | |||||||||||||||||
| 2021 | 435,000 | — | 1,728,750 | 171,227 | — | 2,334,977 | |||||||||||||||||
| Luke Scrivanich Senior Vice President and General Manager, Optical Security & Performance Products (OSP) | 2023 | 398,077 | — | 995,962 | 19,362 | 5,000 | 1,418,401 | ||||||||||||||||
| 2022 | 383,769 | — | 970,448 | 257,847 | 5,000 | 1,617,064 | |||||||||||||||||
| 2021 | 372,000 | — | 1,782,887 | 442,680 | 4,000 | 2,601,567 | |||||||||||||||||
| Gary Staley Senior Vice President, Global Sales, Network Enablement and Service Enablement | 2023 | 416,154 | — | 1,106,642 | 49,980 | 5,000 | 1,577,776 | ||||||||||||||||
| 2022 | 391,346 | — | 1,078,256 | 343,016 | 5,000 | 1,817,618 | |||||||||||||||||
| 2021 | 375,000 | — | 2,160,967 | 150,884 | 4,000 | 2,690,851 | |||||||||||||||||
Name and Principal Position | Year | Salary ($) | Bonus ($) | Stock Awards ($) (1) | Option Awards ($) (2) | Non-Equity Incentive Plan Compensation ($) (3) | All Other Compensation ($) (4) | Total ($) | |
| Oleg Khaykin President and Chief Executive Officer | 2020 | 800,000 | — | 5,669,190 | — | 662,400 | 4,000 | 7,135,590 | |
| 2019 | 800,000 | — | 5,081,397 | — | 1,056,681 | 4,000 | 6,942,078 | ||
| 2018 | 750,000 | — | 4,064,900 | — | 135,000 | 4,000 | 4,953,900 | ||
| Amar Maletira Executive Vice President and Chief Financial Officer | 2020 | 500,000 | — | 2,771,150 | — | 345,000 | 4,000 | 3,620,150 | |
| 2019 | 500,000 | — | 2,067,567 | — | 452,093 | 4,000 | 3,023,660 | ||
| 2018 | 425,000 | 180,000 | 1,759,017 | — | 65,024 | 4,000 | 2,433,041 | ||
| Paul McNab Executive Vice President and Chief Marketing & Strategy Officer | 2020 | 435,000 | — | 1,020,950 | — | 273,615 | — | 1,729,565 | |
| 2019 | 435,000 | — | 738,500 | — | 303,254 | — | 1,476,754 | ||
| 2018 | 435,000 | — | 567,900 | — | 97,984 | — | 1,100,884 | ||
| Luke Scrivanich Senior Vice President and General Manager, Optical Security & Performance Products (OSP) | 2020 | 372,000 | — | 875,100 | — | 202,368 | 4,000 | 1,453,468 | |
| 2019 | 372,000 | — | 738,500 | — | 442,680 | 4,000 | 1,557,180 | ||
| 2018 | 372,000 | — | 567,900 | — | — | 4,000 | 943,900 | ||
| Gary Staley Senior Vice President, Global Sales, Network Enablement and Service Enablement | 2020 | 375,000 | — | 1,093,875 | — | 229,500 | 4,000 | 1,702,375 | |
| 2019 | 375,000 | — | 968,100 | — | 150,614 | 4,000 | 1,497,714 | ||
| 2018 | 360,000 | — | 901,988 | — | 71,550 | 5,638 | 1,339,176 | ||
| Name | Fiscal Year | Maximum Possible Value of MSUs Using Grant Date Fair Value | ||||||
| Oleg Khaykin | 2023 | 6,547,009 | ||||||
| 2022 | 6,131,200 | |||||||
| 2021 | 6,143,444 | |||||||
| Henk Derksen | 2023 | 1,793,705 | ||||||
| 2022 | 875,860 | |||||||
| 2021 | 2,949,602 | |||||||
| Paul McNab | 2023 | 762,318 | ||||||
| 2022 | 744,489 | |||||||
| 2021 | 702,097 | |||||||
| Luke Scrivanich | 2023 | 807,154 | ||||||
| 2022 | 788,289 | |||||||
| 2021 | 745,990 | |||||||
| Gary Staley | 2023 | 896,852 | ||||||
| 2022 | 875,860 | |||||||
| 2021 | 1,333,270 | |||||||
| Name | Fiscal Year | Maximum Possible Value of MSUs Using Grant Date Fair Value | Maximum Possible Value of PSUs Using Grant Date Fair Value |
| Oleg Khaykin | 2020 | 4,527,383 | — |
| 2019 | 4,067,526 | — | |
| 2018 | 2,457,750 | 909,900 | |
| Amar Maletira | 2020 | 2,213,025 | — |
| 2019 | 1,379,350 | — | |
| 2018 | 1,015,870 | 454,950 | |
| Paul McNab | 2020 | 815,325 | — |
| 2019 | 591,150 | — | |
| 2018 | 442,395 | — | |
| Luke Scrivanich | 2020 | 698,850 | — |
| 2019 | 591,150 | — | |
| 2018 | 442,395 | — | |
| Gary Staley | 2020 | 873,563 | — |
| 2019 | 591,150 | — | |
| 2018 | 943,527 | — | |
| Name | H1FY20 VPP (Actual) | H2FY20 VPP (Forfeited) | ||||
| Oleg Khaykin | $513,600 | $148,800 | ||||
| Amar Maletira | $267,500 | $77,500 | ||||
| Paul McNab | $236,640 | $36,975 | ||||
| Luke Scrivanich | $135,966 | $66,402 | ||||
| Gary Staley | $189,656 | $39,844 | ||||
| Executive Compensation and Other Information | ||
| GRANTS OF PLAN BASED AWARDS | ||||||||||||||||||||||||||||||||||||||
Estimated Future Payouts Under Non- Equity Incentive Plan Awards (1) | Estimated Future Payouts Under Equity Incentive Plan Awards(2) | All Other Stock Awards: | ||||||||||||||||||||||||||||||||||||
| Name | Grant Date | Approval Date | Award Type | Threshold ($) | Target ($) | Maximum ($) | Threshold (#) | Target (#) | Maximum (#) | Number of Shares of Stock (#) | Grant Date Fair Value of Stock Awards(3) ($) | |||||||||||||||||||||||||||
| Oleg Khaykin | 8/28/2022 | 8/17/2022 | MSUs | 0 | 255,244 | 382,866 | 4,364,672 | |||||||||||||||||||||||||||||||
| 8/28/2022 | 8/17/2022 | RSUs | 255,244 | (4) | 3,713,800 | |||||||||||||||||||||||||||||||||
| N/A | N/A | Cash | 0 | 1,125,000 | 1,687,500 | |||||||||||||||||||||||||||||||||
| Incentive | ||||||||||||||||||||||||||||||||||||||
| Henk Derksen | 8/28/2022 | 8/17/2022 | MSUs | 0 | 69,930 | 104,895 | 1,195,803 | |||||||||||||||||||||||||||||||
| 8/28/2022 | 8/17/2022 | RSUs | 0 | 69,930 | (4) | 1,017,482 | ||||||||||||||||||||||||||||||||
| N/A | N/A | Cash | 0 | 525,000 | 787,500 | |||||||||||||||||||||||||||||||||
| Incentive | ||||||||||||||||||||||||||||||||||||||
| Paul McNab | 8/28/2022 | 8/17/2022 | MSUs | 0 | 29,720 | 44,580 | 508,212 | |||||||||||||||||||||||||||||||
| 8/28/2022 | 8/17/2022 | RSUs | 29,720 | (4) | 432,426 | |||||||||||||||||||||||||||||||||
| N/A | N/A | Cash | 0 | 382,500 | 573,750 | |||||||||||||||||||||||||||||||||
| Incentive | ||||||||||||||||||||||||||||||||||||||
| Luke Scrivanich | 8/28/2022 | 8/17/2022 | MSUs | 0 | 31,468 | 47,202 | 538,103 | |||||||||||||||||||||||||||||||
| 8/28/2022 | 8/17/2022 | RSUs | 31,468 | (4) | 457,859 | |||||||||||||||||||||||||||||||||
| N/A | N/A | Cash | 0 | 340,000 | 510,000 | |||||||||||||||||||||||||||||||||
| Incentive | ||||||||||||||||||||||||||||||||||||||
| Gary Staley | 8/28/2022 | 8/17/2022 | MSUs | 0 | 34,965 | 52,448 | 597,902 | |||||||||||||||||||||||||||||||
| 8/28/2022 | 8/17/2022 | RSUs | 34,965 | (4) | 508,741 | |||||||||||||||||||||||||||||||||
| N/A | N/A | Cash | 0 | 357,000 | 678,300 | |||||||||||||||||||||||||||||||||
| Incentive | ||||||||||||||||||||||||||||||||||||||
| GRANTS OF PLAN BASED AWARDS | |||||||||||||||
Estimated Future Payouts Under Non- Equity Incentive Plan Awards (1) | Estimated Future Payouts Under Equity Incentive Plan Awards(2) | All Other Stock Awards: Number of Shares of Stock (#) (3) | Grant Date Fair Value of Stock Awards ($) (4) | ||||||||||||
| Name | Grant Date | Approval Date | Award Type | Threshold ($) | Target ($) | Maximum ($) | Threshold (#) | Target (#) | Maximum (#) | ||||||
| Oleg Khaykin | 8/28/19 | 8/20/19 | MSUs | 97,175 | 194,350 | 291,525 | 3,018,256 | ||||||||
| 8/28/19 | 8/20/19 | RSUs | 194,350 | 2,650,934 | |||||||||||
| N/A | N/A | Cash | 0 | 960,000 | 1,344,000 | N/A | |||||||||
| Incentive | |||||||||||||||
| Amar Maletira | 8/28/19 | 8/20/19 | MSUs | 47,500 | 95,000 | 142,500 | 1,475,350 | ||||||||
| 8/28/19 | 8/20/19 | RSUs | 95,000 | 1,295,800 | |||||||||||
| N/A | N/A | Cash | 0 | 500,000 | 700,000 | N/A | |||||||||
| Incentive | |||||||||||||||
| Paul McNab | 8/28/19 | 8/20/19 | MSUs | 17,500 | 35,000 | 52,500 | 543,550 | ||||||||
| 8/28/19 | 8/20/19 | RSUs | 35,000 | 477,400 | |||||||||||
| N/A | N/A | Cash | 0 | 369,750 | 517,650 | N/A | |||||||||
| Incentive | |||||||||||||||
| Luke Scrinavich | 8/28/19 | 8/20/19 | MSUs | 15,000 | 30,000 | 45,000 | 465,900 | ||||||||
| 8/28/19 | 8/20/19 | RSUs | 30,000 | 409,200 | |||||||||||
| N/A | N/A | Cash | 0 | 316,200 | 442,680 | N/A | |||||||||
| Incentive | |||||||||||||||
| Gary Staley | 8/28/19 | 8/20/19 | MSUs | 18,750 | 37,500 | 56,250 | 582,375 | ||||||||
| 8/28/19 | 8/20/19 | RSUs | 37,500 | 511,500 | |||||||||||
| N/A | N/A | Cash | 0 | 318,750 | 573,750 | N/A | |||||||||
| Incentive | |||||||||||||||
| OUTSTANDING EQUITY AWARDS AT FISCAL YEAR-END OPTION AWARDS | STOCK AWARDS | ||||||||||||||||||||||||||||||||||
| Equity Incentive Plan Awards: | Equity Incentive Plan Awards: | ||||||||||||||||||||||||||||||||||
| Name | Grant Date | Number of Securities Underlying Unexercised Options (#) Exercisable | Number of Securities Underlying Unexercised Options (#) Unexercisable | Option Exercise Price ($) | Option Expiration Date | Number of Shares or Units of Stock That Have Not Vested (#) | Market Value of Shares or Units of Stock That Have Not Vested ($)(1) | Number of Unearned Shares, Units or Other Rights That Have Not Vested (#) | Market or Payout Value of Unearned Shares, Units or Other Rights That Have Not Vested ($)(1) | ||||||||||||||||||||||||||
| Oleg Khaykin | 2/15/2016 | 1,180,257(2) | 5.95 | 2/15/2024 | |||||||||||||||||||||||||||||||
| 8/28/2020 | 87,852 | (3) | 995,363 | ||||||||||||||||||||||||||||||||
| 2/28/2021 | 245,000 | (4) | 2,775,850 | ||||||||||||||||||||||||||||||||
| 2/28/2021 | 122,500 | (5) | 1,387,925 | ||||||||||||||||||||||||||||||||
| 8/28/2021 | 138,394 | 1,568,004 | |||||||||||||||||||||||||||||||||
| 8/28/2022 | 255,244 | (6) | 2,891,915 | ||||||||||||||||||||||||||||||||
| 8/28/2020 | 131,778 | (7) | 1,493,045 | ||||||||||||||||||||||||||||||||
| 2/28/2021 | 122,500 | (8) | 1,387,925 | ||||||||||||||||||||||||||||||||
| 8/28/2021 | 207,591 | (7) | 2,352,006 | ||||||||||||||||||||||||||||||||
| 8/28/2022 | 255,244 | (7) | 2,891,915 | ||||||||||||||||||||||||||||||||
| Henk Derksen | 5/28/2021 | 45,815 | (9) | 519,084 | |||||||||||||||||||||||||||||||
| 8/28/2021 | 19,770 | (6) | 223,994 | ||||||||||||||||||||||||||||||||
| 8/28/2022 | 69,930 | (3) | 792,307 | ||||||||||||||||||||||||||||||||
| 5/28/2021 | 68,723 | (10) | 778,626 | ||||||||||||||||||||||||||||||||
| 8/28/2021 | 29,655 | (7) | 582,276 | ||||||||||||||||||||||||||||||||
| 8/28/2022 | 69,930 | (7) | 792,307 | ||||||||||||||||||||||||||||||||
| Paul McNab | 8/28/2020 | 10,040 | (3) | 113,753 | |||||||||||||||||||||||||||||||
| 2/28/2021 | 30,000 | (4) | 339,900 | ||||||||||||||||||||||||||||||||
| 8/28/2021 | 16,805 | (6) | 190,401 | ||||||||||||||||||||||||||||||||
| 8/28/2022 | 29,720 | (3) | 336,728 | ||||||||||||||||||||||||||||||||
| 8/28/2020 | 15,060 | (7) | 170,630 | ||||||||||||||||||||||||||||||||
| 2/28/2021 | 30,000 | (8) | 339,900 | ||||||||||||||||||||||||||||||||
| 8/28/2021 | 25,207 | (7) | 285,595 | ||||||||||||||||||||||||||||||||
| 8/28/2022 | 29,720 | (7) | 335,991 | ||||||||||||||||||||||||||||||||
| Luke Scrivanich | 8/28/2020 | 10,668 | (3) | 120,868 | |||||||||||||||||||||||||||||||
| 2/28/2021 | 30,000 | (4) | 339,900 | ||||||||||||||||||||||||||||||||
| 8/28/2021 | 17,794 | (6) | 201,606 | ||||||||||||||||||||||||||||||||
| 8/28/2022 | 31,468 | (3) | 356,532 | ||||||||||||||||||||||||||||||||
| 8/28/2020 | 16,002 | (7) | 181,303 | ||||||||||||||||||||||||||||||||
| 2/28/2021 | 30,000 | (8) | 339,900 | ||||||||||||||||||||||||||||||||
| 8/28/2021 | 26,690 | (7) | 302,392 | ||||||||||||||||||||||||||||||||
| 8/28/2022 | 31,468 | (7) | 356,532 | ||||||||||||||||||||||||||||||||
| Gary Staley | 8/28/2020 | 12,551 | (3) | 142,203 | |||||||||||||||||||||||||||||||
| 2/28/2021 | 37,500 | (4) | 424,875 | ||||||||||||||||||||||||||||||||
| 8/28/2021 | 19,770 | (6) | 223,994 | ||||||||||||||||||||||||||||||||
| 8/28/2022 | 34,965 | (3) | 396,153 | ||||||||||||||||||||||||||||||||
| 8/28/2020 | 18,827 | (7) | 213,304 | ||||||||||||||||||||||||||||||||
| 2/28/2021 | 37,500 | (8) | 424,875 | ||||||||||||||||||||||||||||||||
| 8/28/2021 | 29,655 | (7) | 335,991 | ||||||||||||||||||||||||||||||||
| 8/28/2022 | 34,965 | (7) | 396,153 | ||||||||||||||||||||||||||||||||
| OUTSTANDING EQUITY AWARDS AT FISCAL YEAR-END | ||||||||||||
| OPTION AWARDS | STOCK AWARDS | |||||||||||
| Name | Grant Date | Number of Securities Underlying Unexercised Options (#) Exercisable | Number of Securities Underlying Unexercised Options (#) Unexercisable | Option Exercise Price ($) | Option Expiration Date | Number of Shares or Units of Stock That Have Not Vested (#) | Market Value of Shares or Units of Stock That Have Not Vested ($)(1) | Equity Incentive Plan Awards: Number of Unearned Shares, Units or Other Rights That Have Not Vested (#) | Equity Incentive Plan Awards: Market or Payout Value of Unearned Shares, Units or Other Rights That Have Not Vested (#)(1) | |||
| Oleg Khaykin | 2/15/16 | 1,180,257 | (2) | 5.95 | 02/15/24 | |||||||
| 8/28/17 | 12,563 | (4) | 157,038 | |||||||||
| 8/28/18 | 86,439 | (4) | 1,080,488 | |||||||||
| 8/28/19 | 194,350 | (4) | 2,429,375 | |||||||||
| 8/28/17 | 50,000 | (6) | 625,000 | |||||||||
| 8/28/17 | 22,500 | (7) | 281,250 | |||||||||
| 8/28/18 | 137,614 | (6) | 1,720,175 | |||||||||
| 8/28/19 | 194,350 | (6) | 2,429,375 | |||||||||
| Amar Maletira | 8/28/17 | 5,193 | (4) | 64,913 | ||||||||
| 8/28/18 | 29,313 | (4) | 366,413 | |||||||||
| 8/28/18 | 15,000 | (8) | 187,500 | |||||||||
| 8/28/19 | 95,000 | (4) | 1,187,500 | |||||||||
| 8/28/17 | 20,668 | (6) | 258,350 | |||||||||
| 8/28/17 | 11,250 | (7) | 140,625 | |||||||||
| 8/28/18 | 46,667 | (6) | 583,338 | |||||||||
| 8/28/19 | 95,000 | (6) | 1,187,500 | |||||||||
| Paul McNab | 8/28/17 | 2,262 | (4) | 28,275 | ||||||||
| 8/28/18 | 12,563 | (4) | 157,038 | |||||||||
| 8/28/19 | 35,000 | (4) | 437,500 | |||||||||
| 8/28/17 | 9,000 | (6) | 112,500 | |||||||||
| 8/28/18 | 20,000 | (6) | 250,000 | |||||||||
| 8/28/19 | 35,000 | (6) | 437,500 | |||||||||
| Luke Scrivanich | 8/28/17 | 2,262 | (4) | 28,275 | ||||||||
| 8/28/18 | 12,563 | (4) | 157,038 | |||||||||
| 8/28/19 | 30,000 | (4) | 375,000 | |||||||||
| 8/28/17 | 9,000 | (6) | 112,500 | |||||||||
| 8/28/18 | 20,000 | (6) | 250,000 | |||||||||
| 8/28/19 | 30,000 | (6) | 375,000 | |||||||||
| Gary Staley | 2/15/17 | 7,062 | (3) | 88,275 | ||||||||
| 8/28/17 | 2,262 | (4) | 28,275 | |||||||||
| 8/28/18 | 12,563 | (4) | 157,038 | |||||||||
| 8/28/18 | 10,000 | (8) | 125,000 | |||||||||
| 8/28/18 | 37,500 | (4) | 468,750 | |||||||||
| 8/28/17 | 9,000 | (6) | 112,500 | |||||||||
| 8/28/17 | 14,822 | (5) | 185,275 | |||||||||
| 8/28/18 | 20,000 | (6) | 250,000 | |||||||||
| 8/28/19 | 37,500 | (6) | 468,750 | |||||||||
| OPTION EXERCISES AND STOCK VESTED | ||||||||||||||
| OPTION AWARDS | STOCK AWARDS | |||||||||||||
| Name | Number of Shares Acquired on Exercise (#) | Value Realized on Exercise ($) | Number of Shares Acquired on Vesting (#) | Value Realized on Vesting ($) (1) | ||||||||||
| Oleg Khaykin | — | — | 471,865 | 6,489,475 | ||||||||||
| Henk Derksen | — | — | 79,124 | 883,698 | ||||||||||
| Paul McNab | — | — | 60,830 | 835,362 | ||||||||||
| Luke Scrivanich | — | — | 61,360 | 843,291 | ||||||||||
| Gary Staley | — | — | 71,737 | 985,610 | ||||||||||
| OPTION EXERCISES AND STOCK VESTED | ||||
| OPTION AWARDS | STOCK AWARDS | |||
| Name | Number of Shares Acquired on Exercise (#) | Value Realized on Exercise ($) | Number of Shares Acquired on Vesting (#) | Value Realized on Vesting ($) (1) |
| Oleg Khaykin | — | — | 261,700 | 3,607,089 |
| Amar Maletira | — | — | 128,373 | 1,796,816 |
| Paul McNab | — | — | 29,204 | 393,923 |
| Luke Scrivanich | — | — | 28,995 | 391,045 |
| Gary Staley | — | — | 43,544 | 594,746 |
| Khaykin Agreement | ||
| Executive Compensation and Other Information | ||
| Derksen Agreement | ||
| Executive Compensation and Other Information | ||
| Executive Compensation and Other Information | ||
| Name | Benefit | Death or Disability($) (1) | Within 12 Months After a Change in Control($) (2) | Termination Not in Connection with a Change in Control ($) (3) | ||||||||||
| Oleg Khaykin | Cash Severance | 3,037,500 | 3,881,250 | 3,037,500 | ||||||||||
| Equity Award Acceleration | 16,462,263 | 16,462,263 | 8,982,617 | |||||||||||
| COBRA | — | 37,974 | 37,974 | |||||||||||
Henk Derksen(4) | Cash Severance | — | 1,050,000 | 787,500 | ||||||||||
| Equity Award Acceleration | 3,070,781 | 3,070,781 | — | |||||||||||
| COBRA | — | 27,053 | 40,580 | |||||||||||
| Paul McNab | Cash Severance | — | 900,000 | — | ||||||||||
| Equity Award Acceleration | 1,961,552 | 1,961,552 | — | |||||||||||
| COBRA | — | 27,053 | — | |||||||||||
| Luke Scrivanich | Cash Severance | — | 800,000 | — | ||||||||||
| Equity Award Acceleration | 2,037,802 | 2,037,802 | — | |||||||||||
| COBRA | — | 16,792 | — | |||||||||||
| Gary Staley | Cash Severance | — | 630,000 | — | ||||||||||
| Equity Award Acceleration | 2,374,451 | 2,374,451 | — | |||||||||||
| COBRA | — | 27,053 | — | |||||||||||
| POTENTIAL PAYMENTS UPON TERMINATION OR CHANGE IN CONTROL | |||||||
| Name | Benefit | Death or Disability ($) (2) | Within 12 Months After a Change in Control ($) (3) | Termination Not in Connection with a Change in Control ($) | |||
Oleg Khaykin (1) | Salary | 0 | 3,360,000 | 2,640,000 | |||
| Securities | 8,722,700 | 8,722,700 | 7,302,513 | ||||
| COBRA | 0 | 34,944 | 34,944 | ||||
| Amar Maletira | Salary | 0 | 1,000,000 | 750,000 | |||
| Securities | 3,976,138 | 3,976,138 | 0 | ||||
| COBRA | 0 | 23,580 | 0 | ||||
| Paul McNab | Salary | 0 | 870,000 | 652,500 | |||
| Securities | 1,422,813 | 1,422,813 | 0 | ||||
| COBRA | 0 | 24,889 | 0 | ||||
| Luke Scrivanich | Salary | 0 | 744,000 | 558,000 | |||
| Securities | 1,297,813 | 1,297,813 | 0 | ||||
| COBRA | 0 | 15,456 | 0 | ||||
| Gary Staley | Salary | 0 | 562,500 | 375,000 | |||
| Securities | 1,883,863 | 1,883,863 | 0 | ||||
| COBRA | 0 | 24,889 | 0 | ||||
| Countries | # of Employees | % of Employees | ||||||
| Netherlands | 1 | 0.03% | ||||||
| Norway | 1 | 0.03% | ||||||
| Denmark | 2 | 0.05% | ||||||
| Poland | 2 | 0.05% | ||||||
| Switzerland | 2 | 0.05% | ||||||
| Austria | 3 | 0.08% | ||||||
| Georgia | 4 | 0.11% | ||||||
| Hong Kong | 4 | 0.11% | ||||||
| United Arab Emirates | 6 | 0.16% | ||||||
| Australia | 7 | 0.19% | ||||||
| Finland | 9 | 0.25% | ||||||
| Taiwan | 11 | 0.30% | ||||||
| Sweden | 12 | 0.33% | ||||||
| Spain | 23 | 0.63% | ||||||
| Ireland | 28 | 0.77% | ||||||
| Japan | 30 | 0.82% | ||||||
| Brazil | 34 | 0.93% | ||||||
| Total Employees Excluded | 179 | 4.90% | ||||||
| Executive Compensation and Other Information | ||
Year(1) (a) | Summary Compensation Table Total for PEO (b) | Compensation Actually Paid to PEO (2)(3) (c) | Average Summary Compensation Table Total for Non-PEO Named Executive Officers (d) | Average Compensation Actually Paid to Non-PEO Named Executive Officers(2)(4) (e) | Value of Initial Fixed $100 Investment Based On:(5) | Net Income(in millions) (h) | Consolidated Non-GAAP Operating Income (in millions)(6) (i) | |||||||||||||||||||
| Total Shareholder Return (f) | Peer Group Total Shareholder Return (g) | |||||||||||||||||||||||||
| 2023 | $8,978,665 | $5,273,915 | $1,779,833 | $1,142,474 | $91 | $95 | $25.5 | $172.5 | ||||||||||||||||||
| 2022 | $9,340,416 | $2,475,672 | $1,807,445 | $812,945 | $105 | $93 | $15.5 | $286.8 | ||||||||||||||||||
| 2021 | $16,868,008 | $20,204,757 | $2,690,648 | $1,913,339 | $140 | $127 | $67.5 | $253.5 | ||||||||||||||||||
| PEO | Non-PEO NEOs | |||||||
| 2023 | Oleg Khaykin | Henk Derksen, Paul McNab, Luke Scrivanich and Gary Staley | ||||||
| 2022 | Oleg Khaykin | Henk Derksen, Paul McNab, Luke Scrivanich and Gary Staley | ||||||
| 2021 | Oleg Khaykin | Amar Maletira, Paul McNab, Luke Scrivanich, Gary Staley, Amar Maletira and Pam Avent | ||||||
| Pension Plan Adjustments | Equity Award Adjustments | ||||||||||||||||||||||||||||||||||
| Summary Compensation Table Total for PEO | Change in Pension Value | Pension Service Cost | Stock Awards | Year End Fair Value of Equity Awards Granted in the Year and Unvested at Year End | Year over Year Change in Fair Value of Outstanding and Unvested Equity Awards Granted in Prior Years | Fair Value as of Vesting Date of Equity Awards Granted and Vested in the Year | Change in Fair Value of Equity Awards Granted in Prior Years that Vested in the Year | Fair Value at the End of the Prior Year of Equity Awards that Failed to Meet Vesting Conditions in the Year | Value of Dividends or other Earnings Paid on Stock or Option Awards not Otherwise Reflected in Fair Value | Compensation Actually Paid to PEO | |||||||||||||||||||||||||
| 2023 | $8,978,665 | N/A | N/A | ($8,078,473) | $5,533,334 | ($2,036,350) | - | $876,739 | - | - | $5,273,915 | ||||||||||||||||||||||||
| 2022 | $9,340,416 | N/A | N/A | ($7,548,009) | $6,150,273 | ($4,404,592) | - | ($1,062,416) | - | - | $2,475,672 | ||||||||||||||||||||||||
| 2021 | $16,868,008 | N/A | N/A | ($15,169,727) | $17,892,079 | $688,558 | - | ($74,161) | - | - | $20,204,757 | ||||||||||||||||||||||||
| Executive Compensation and Other Information | ||
| Pension Plan Adjustments | Equity Award Adjustments | ||||||||||||||||||||||||||||||||||
| Average Summary Compensation Table Total for Non-PEO NEOs ($) | Change in Pension Value ($) | Pension Service Cost ($) | Stock Awards ($) | Year End Fair Value of Equity Awards Granted in the Year and Unvested at Year End ($) | Year over Year Change in Fair Value of Outstanding and Unvested Equity Awards Granted in Prior Years ($) | Fair Value as of Vesting Date of Equity Awards Granted and Vested in the Year ($) | Change in Fair Value of Equity Awards Granted in Prior Years that Vested in the Year ($) | Fair Value at the End of the Prior Year of Equity Awards that Failed to Meet Vesting Conditions in the Year ($) | Value of Dividends or other Earnings Paid on Stock or Option Awards not Otherwise Reflected in Fair Value ($) | Average Compensation Actually Paid to Non-PEO Named Executive Officers ($) | |||||||||||||||||||||||||
| 2023 | $1,779,833 | N/A | N/A | ($1,314,132) | $900,113 | ($296,655) | - | $73,315 | - | - | $1,142,474 | ||||||||||||||||||||||||
| 2022 | $1,807,445 | N/A | N/A | ($1,010,872) | $823,679 | ($636,360) | - | ($170,947) | - | - | $812,945 | ||||||||||||||||||||||||
| 2021 | $2,690,648 | N/A | N/A | ($2,137,496) | $1,785,693 | $72,144 | - | ($78,732) | ($418,919) | - | $1,913,339 | ||||||||||||||||||||||||
| Seven Most Important Performance Measures | ||
| Consolidated Non-GAAP Operating Income | ||
| Consolidated Revenue | ||
| OSP Revenue | ||
| OSP Non-GAAP Operating Income | ||
| NSE Revenue | ||
| NSE Non-GAAP Operating Income | ||
| Relative TSR | ||
| Executive Compensation and Other Information | ||
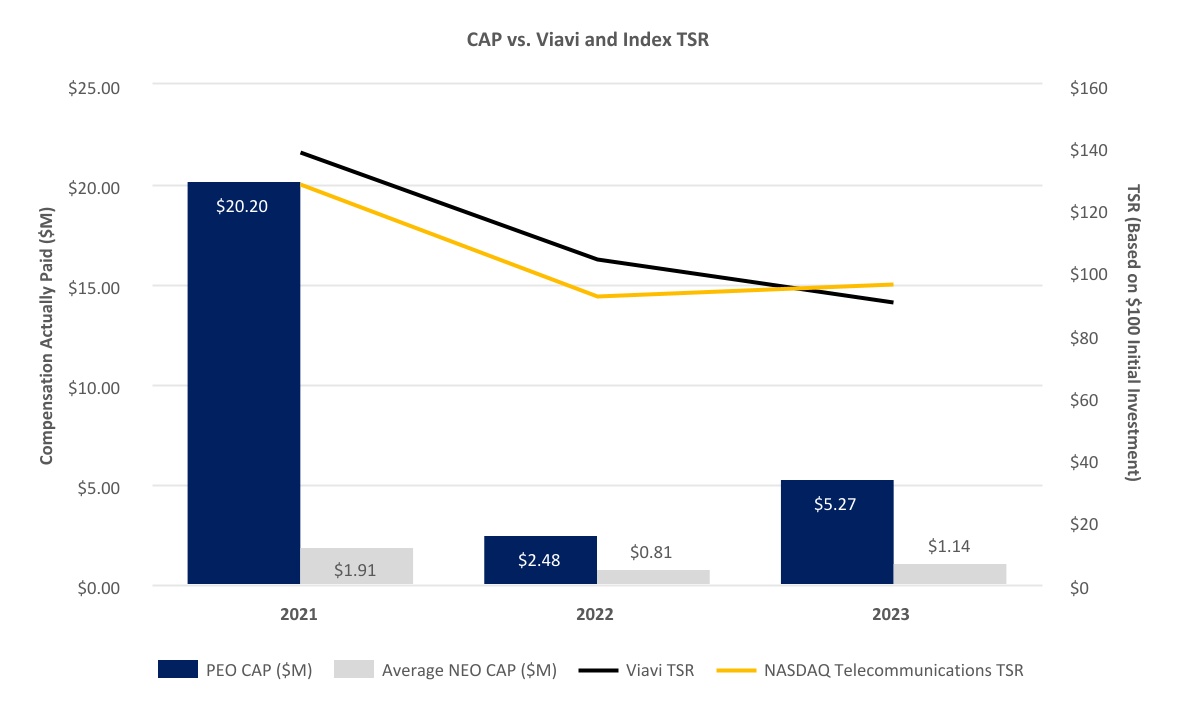
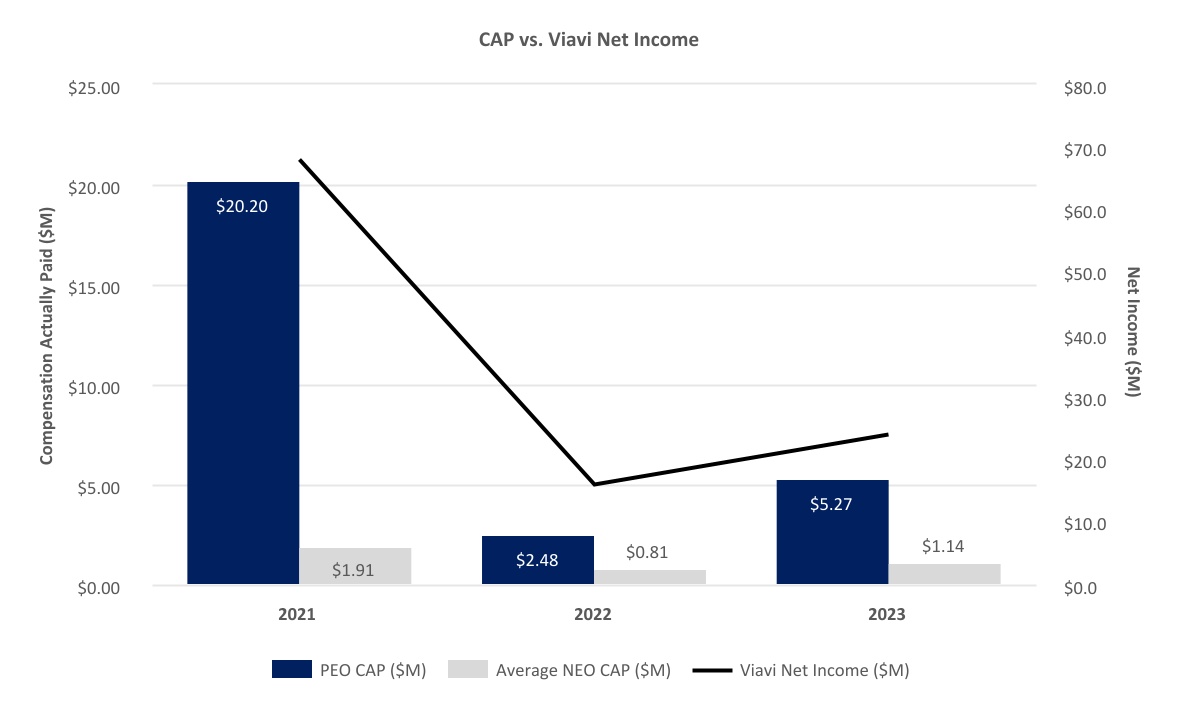
| Executive Compensation and Other Information | ||
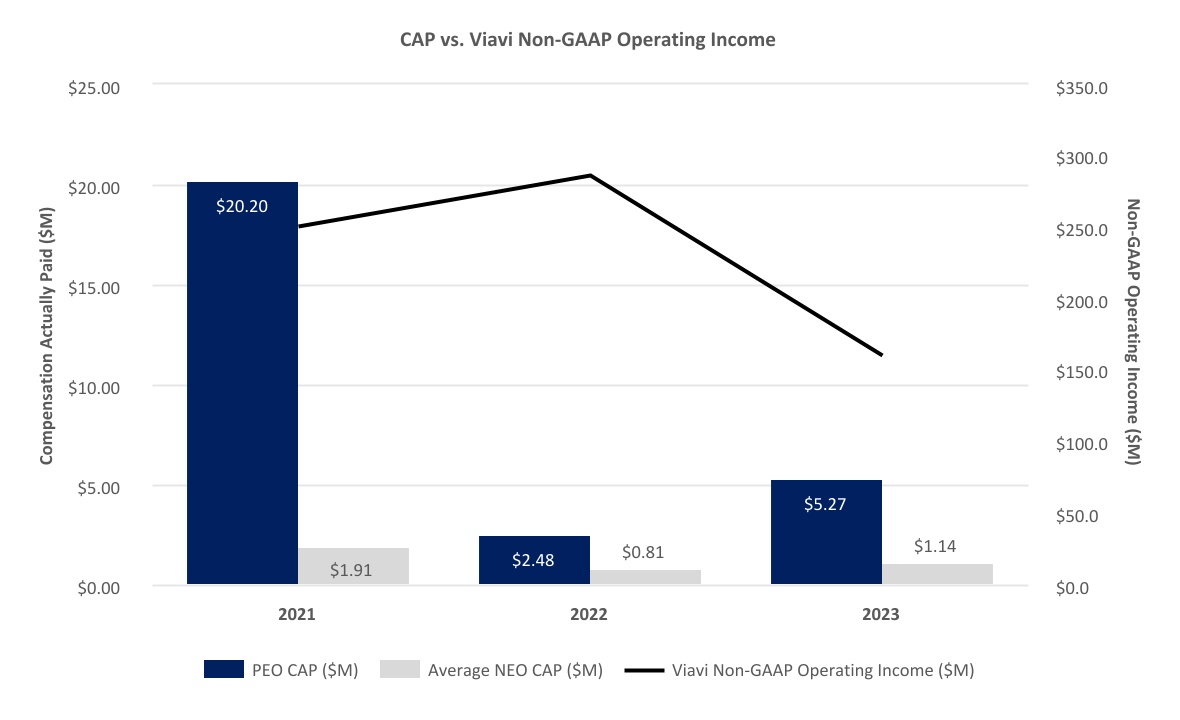
| Executive Compensation and Other Information | ||
| Plan Category | Number of securities to be issued upon exercise of outstanding options, warrants and rights | Weighted- average exercise price of outstanding options, warrants and rights (1) | Number of securities remaining available for future issuance under equity compensation plans (excluding securities reflected in first column) | ||||||||||||||
| Equity compensation plans approved by security holders | 7,497,370 | (2) | n/a | 9,059,960 | (3) | ||||||||||||
| Equity compensation plans not approved by security holders | 1,180,257 | (4) | $ | 5.95 | — | ||||||||||||
| Total/Weighted Ave./Total | 8,677,627 | $ | 5.95 | 9,059,960 | |||||||||||||
| Plan Category | Number of securities to be issued upon exercise of outstanding options, warrants and rights | Weighted- average exercise price of outstanding options, warrants and rights | Number of securities remaining available for future issuance under equity compensation plans (excluding securities reflected in first column) | ||||||
| Equity compensation plans approved by security holders | 6,065,164 | (1) | n/a | 20,573,369 | (2) | ||||
| Equity compensation plans not approved by security holders | 1,180,257 | (3) | $ | 5.95 | — | ||||
| Total/Weighted Ave./Total | 7,245,421 | $ | 5.95 | 20,573,369 | |||||
(2)Represents shares |
| Security Ownership of Certain Beneficial Owners and Management | ||
| Number of Shares Beneficially Owned | ||||||||
| Name | Number | Percentage | ||||||
5% or more Stockholders (1) | ||||||||
Entities affiliated with BlackRock, Inc. (2) | 36,626,880 | 16.2 | % | |||||
The Vanguard Group (3) | 26,707,113 | 11.8 | % | |||||
Entities affiliated with Wellington Management Group LLP (4) | 13,669,095 | 6.04 | % | |||||
| Directors and Executive Officers | ||||||||
Oleg Khaykin (5) | 2,427,141 | * | ||||||
Henk Derksen (6) | 137,555 | * | ||||||
Paul McNab (7) | 106,860 | * | ||||||
Luke Scrivanich (8) | 75,718 | * | ||||||
Gary Staley (9) | 127,989 | * | ||||||
Richard E. Belluzzo (10) | 225,229 | * | ||||||
| Keith Barnes | 152,062 | * | ||||||
| Laura Black | 76,731 | * | ||||||
| Tor Braham | 146,287 | * | ||||||
| Donald Colvin | 146,287 | * | ||||||
Masood A. Jabbar (11) | 258,096 | * | ||||||
| Joanne Solomon | 10,158 | * | ||||||
| All Directors and executive officers as a group (15 persons) | 4,027,703 | 1.80 % | ||||||
| Security Ownership of Certain Beneficial Owners and Management | ||
| Why am I receiving these proxy materials? | ||
| Why is the 2023 Annual Meeting being held as a virtual, online meeting? | ||
| Who can vote their shares and attend the 2023 Annual Meeting? | ||
| How do I virtually attend the 2023 Annual Meeting? | ||
| How do I register to attend the virtual 2023 Annual Meeting? | ||
| General Information | ||
| How do I vote? | ||
| Will you make a list of the stockholders of record entitled to vote at the 2023 Annual Meeting available through electronic means? | ||
| Why did I receive the Notice of Internet Availability of Proxy Materials instead of a full set of proxy materials? | ||
| How do I obtain electronic access to the proxy materials? | ||
| What if I prefer to receive paper copies of the materials? | ||
| General Information | ||
| What is included in the proxy materials? | ||
| How can I avoid having duplicate copies of the Proxy Statement sent to my household? | ||
| What if I return a proxy card but do not make specific choices? | ||
| What constitutes a quorum? | ||
| What proposals will be voted on, the Board of Director’s recommendations, and the applicable voting standards? | ||
| General Information | ||
| Proposal | Voting Options | Board Recommendation | Vote Required to Adopt the Proposal | Effect of Abstentions* | Effect of Broker Non-Votes* | ||||||||||||
| 1. Election of directors | For, against, or abstain on each nominee | “FOR” EACH OF THE NOMINEES | Majority of votes cast** | No effect | No effect | ||||||||||||
| 2. Ratification of the appointment of PricewaterhouseCoopers LLP as the Company’s independent registered public accounting firm for FY24 | For, against, or abstain | “FOR” | Majority of shares present or represented by proxy and entitled to vote*** | Vote against | No effect | ||||||||||||
| 3. Approval, on a non-binding advisory basis, of the compensation of our named executive officers for FY23, as set forth in the Proxy Statement | For, against, or abstain | “FOR” | Majority of shares present or represented by proxy and entitled to vote*** | Vote against | No effect | ||||||||||||
| 4. Approval, on a non-binding advisory basis, of the frequency of stockholder votes on executive compensation | 1 year, 2 years, 3 years, or abstain | “1 YEAR” | The frequency receiving the greatest number of votes will be considered the frequency recommended by stockholders | No effect | No effect | ||||||||||||
| 5. Approval of the amendment and restatement of the 2003 Equity Incentive Plan | For, against, or abstain | “FOR” | Majority of shares present or represented by proxy and entitled to vote*** | Vote against | No effect | ||||||||||||
| 6. Approval of the amendment and restatement of the Employee Stock Purchase Plan | For, against, or abstain | “FOR” | Majority of shares present or represented by proxy and entitled to vote*** | Vote against | No effect | ||||||||||||
| General Information | ||
| Who will tabulate the votes? | ||
| Is my vote confidential? | ||
| Can I change my vote or revoke my proxy after submitting my proxy? | ||
| Who is paying for this proxy solicitation? | ||
| How can I find out the voting results? | ||
| When are stockholder proposals due for next year’s annual meeting? | ||
| General Information | ||
| How do I suggest potential candidates for Director positions? | ||
| APPENDIX A - GAAP to Non-GAAP Reconciliations | ||
Years Ended | |||||||||||||||||||||||
| July 1, 2023 | July 2, 2022 | ||||||||||||||||||||||
| Operating Income | Operating Margin | Operating Income | Operating Margin | ||||||||||||||||||||
| GAAP measures | $ | 82.4 | 7.4 | % | $ | 185.0 | 14.3 | % | |||||||||||||||
| Stock-based compensation | 51.2 | 4.7 | % | 52.3 | 4.1 | % | |||||||||||||||||
| Change in fair value of contingent liability | (4.5) | (0.4) | % | 0.3 | — | % | |||||||||||||||||
Other (benefits) charges unrelated to core operating performance(1) | (2.0) | (0.2) | % | 9.6 | 0.7 | % | |||||||||||||||||
| Amortization of intangibles | 33.3 | 3.0 | % | 39.7 | 3.1 | % | |||||||||||||||||
| Restructuring and related charges (benefits) | 12.1 | 1.1 | % | (0.1) | — | % | |||||||||||||||||
| Total related to Cost of Revenue and Operating Expenses | 90.1 | 8.2 | % | 101.8 | 7.9 | % | |||||||||||||||||
| Non-GAAP measures | $ | 172.5 | 15.6 | % | $ | 286.8 | 22.2 | % | |||||||||||||||
Years Ended | |||||||||||||||||||||||
| July 1, 2023 | July 2, 2022 | ||||||||||||||||||||||
| Net Income | Diluted EPS | Net Income | Diluted EPS | ||||||||||||||||||||
| GAAP measures | $ | 25.5 | $ | 0.11 | $ | 15.5 | $ | 0.07 | |||||||||||||||
| Items reconciling GAAP net income and EPS to non-GAAP net income and EPS: | |||||||||||||||||||||||
| Stock-based compensation | 51.2 | 0.23 | 52.3 | 0.22 | |||||||||||||||||||
| Change in fair value of contingent liability | (4.5) | (0.02) | 0.3 | — | |||||||||||||||||||
Other (benefits) charges unrelated to core operating performance(1) | (2.0) | (0.01) | 9.6 | 0.04 | |||||||||||||||||||
| Amortization of intangibles | 33.3 | 0.15 | 39.7 | 0.17 | |||||||||||||||||||
| Restructuring and related charges (benefits) | 12.1 | 0.05 | (0.1) | — | |||||||||||||||||||
Non-cash interest expense and other expense (2) | 3.9 | 0.02 | 102.2 | 0.43 | |||||||||||||||||||
| Benefit from income taxes | 5.2 | 0.02 | 5.8 | 0.02 | |||||||||||||||||||
| Total related to Net income and EPS | 99.2 | 0.44 | 209.8 | 0.88 | |||||||||||||||||||
| Non-GAAP measures | $ | 124.7 | $ | 0.55 | $ | 225.3 | $ | 0.95 | |||||||||||||||
| Shares used in per share calculation for Non-GAAP EPS | 226.6 | 238.2 | |||||||||||||||||||||
| Years Ended | |||||||||||||
| June 27, 2020 | June 29, 2019 | ||||||||||||
| Operating Income | Operating Margin | Operating Income | Operating Margin | ||||||||||
| Net Revenue | $ | 1,136.3 | $ | 1,130.3 | |||||||||
| GAAP measures from continuing operations | $ | 118.1 | 10.4 | % | $ | 67.4 | 6.0 | % | |||||
| Stock-based compensation | 44.6 | 3.9 | % | 38.2 | 3.4 | % | |||||||
| Change in fair value of contingent liability | (31.5 | ) | (2.8 | )% | (5.9 | ) | (0.5 | )% | |||||
| Other charges unrelated to core operating performance (1) | 8.4 | 0.8 | % | 10 | 0.9 | % | |||||||
| Amortization of intangibles | 67.8 | 6.0 | % | 72.5 | 6.4 | % | |||||||
| Restructuring and related charges | 3.5 | 0.3 | % | 15.4 | 1.3 | % | |||||||
| Total related to Cost of Revenue and Operating Expenses | 92.8 | 8.2 | % | 130.2 | 11.5 | % | |||||||
| Non-GAAP measures from continuing operations | $ | 210.9 | 18.6 | % | $ | 197.6 | 17.5 | % | |||||
| Years Ended | |||||||||||||||
| June 27, 2020 | June 29, 2019 | ||||||||||||||
| Net (Loss) Income | Diluted EPS | Net (Loss) Income | Diluted EPS | ||||||||||||
| GAAP measures from continuing operations | $ | 28.7 | $ | 0.12 | $ | 7.8 | $ | 0.03 | |||||||
| Items reconciling GAAP net income and EPS to non-GAAP net income and EPS: | |||||||||||||||
| Stock-based compensation | 44.6 | 0.19 | 38.2 | 0.17 | |||||||||||
| Change in fair value of contingent liability | (31.5 | ) | (0.13 | ) | (5.9 | ) | (0.03 | ) | |||||||
| Other charges unrelated to core operating performance (1) | 8.4 | 0.04 | 10.5 | 0.05 | |||||||||||
| Amortization of intangibles | 67.8 | 0.29 | 72.5 | 0.31 | |||||||||||
| Restructuring and related charges (benefits) | 3.5 | 0.01 | 15.4 | 0.07 | |||||||||||
| Non-cash interest expense and other expense | 20.7 | 0.09 | 21 | 0.09 | |||||||||||
| Withholding income taxes | 31.6 | 0.14 | — | — | |||||||||||
| Benefits/charges from income taxes | (2.5 | ) | (0.01 | ) | (3.3 | ) | (0.01 | ) | |||||||
| Total related to net income and EPS | 142.6 | 0.61 | 148.4 | 0.64 | |||||||||||
| Non-GAAP measures from continuing operations | $ | 171.3 | $ | 0.73 | $ | 156.2 | $ | 0.68 | |||||||
| Shares used in per share calculation for Non-GAAP EPS | 233.7 | 231.2 | |||||||||||||
| Note: Certain totals may not add due to rounding | |||||||||||||||
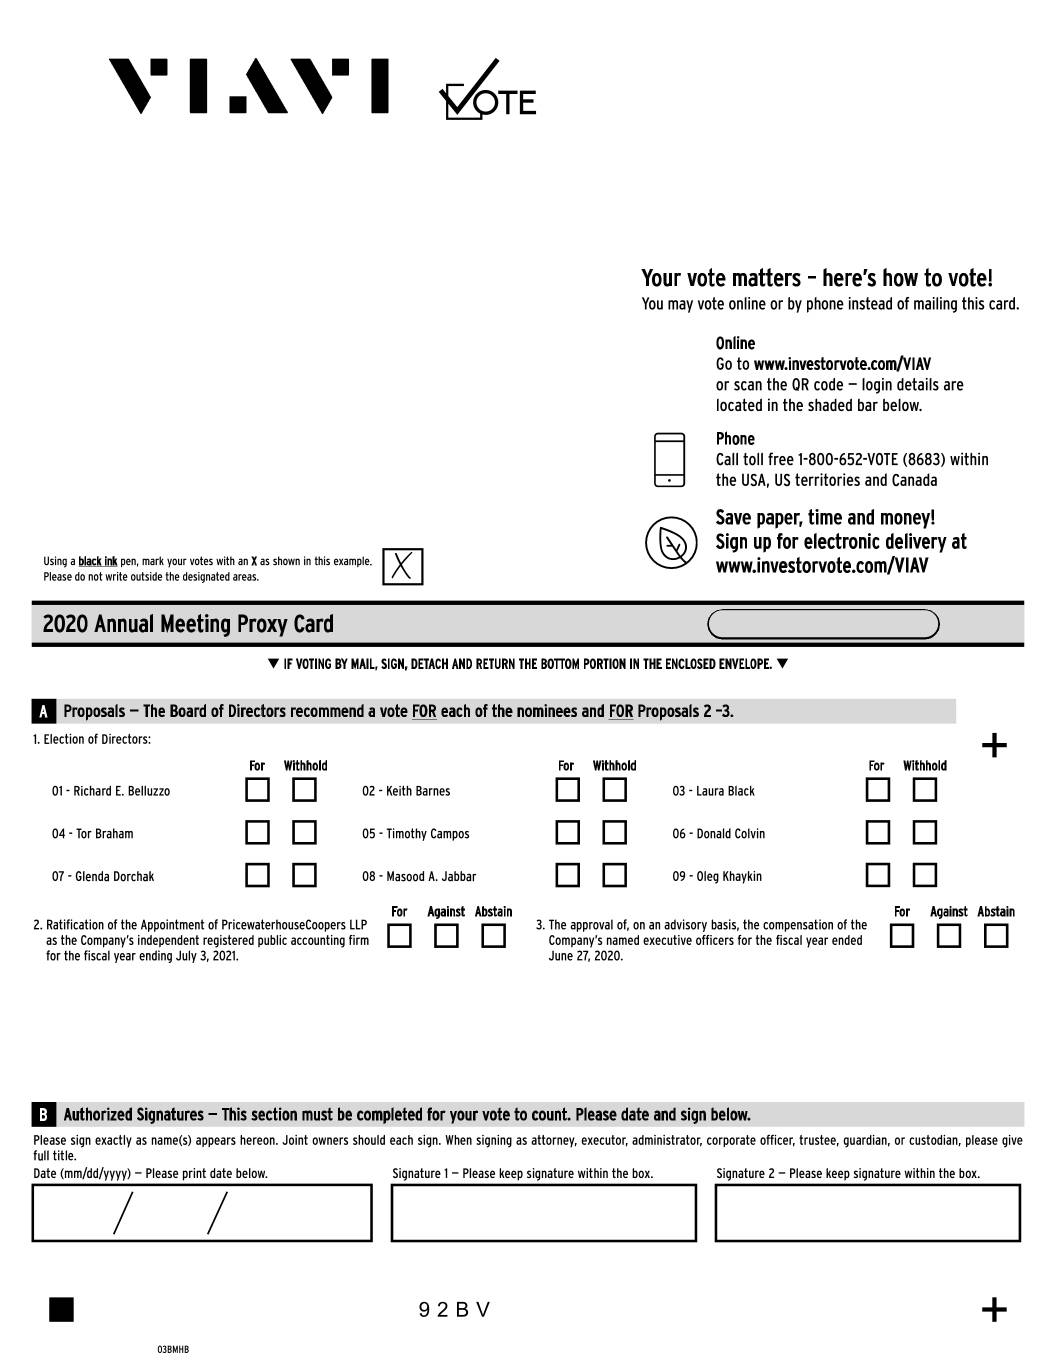
| Canada | Securities Law Notice. The Stock subject to purchase rights under the Plan are being offered pursuant to an exemption from the prospectus requirements of applicable securities legislation in Canada. You acknowledge that as long as the Company is not a reporting issuer in any jurisdiction in Canada, the purchase rights and the underlying Shares will be subject to an indefinite hold period in Canada and subject to restrictions on their transfer in Canada. Subject to applicable securities laws, you are permitted to sell Shares acquired through the Plan through the designated broker appointed under the Plan, assuming the sale of such Shares takes place outside Canada via the stock exchange on which the Shares are traded. Foreign Ownership Reporting. If you are a Canadian resident, your ownership of certain foreign property (including shares of foreign corporations) in excess of $100,000 may be subject to strict annual tax reporting obligations. Please refer to CRA Form T1135 (Foreign Income Verification Statement) and consult your tax advisor for further details. It is your responsibility to comply with all applicable tax reporting requirements. Participant domiciled in the Canadian Province of Quebec, or who work at a Company site located in the Canadian Province of Quebec, agree that the Plan be drafted in English. Je conviens que le présent accord de quittance soit rédigé en anglais. Such Participant further acknowledge that French translations of the Plan are available upon request. | ||||